CS437 Selected Lecture Notes
This is one big WEB page, used for printing
 These are not intended to be complete lecture notes.
 Complicated figures or tables or formulas are included here
 in case they were not clear or not copied correctly in class.
 Computer commands, directory names and file names are included.
 Specific help may be included here yet not presented in class.
 Source code may be included in line or by a link.

 Lecture numbers correspond to the syllabus numbering.
Lecture 1, Introduction
Getting Started, solving setup problems
Lecture 2, Mouse Handling
Lecture 3, Color
Lecture 4, Multiple windows and motion
Lecture 5, Menu Design and Implementation
Lecture 6, Getting user input
Lecture 7, Text sizes and fonts, international
Lecture 8, Writing and restoring users work
Lecture 9a, Painters Algorithm, Display list
Lecture 9, Review 1
Lecture 10, Quiz 1
Lecture 11, Pan, Zoom, Scroll Bars
Lecture 12, Timing
Lecture 13, Motion and movement, scenes
Lecture 14, Curves and surfaces, targets
Lecture 15, Parallelism in your GUI
Lecture 16, 3D with motion
Lecture 17, Kinematics and timing
Lecture 18, User Interface for Platform
Lecture 18, Rendering Survey
Lecture 19a, Captuting Screen
Lecture 19, Review 2
Lecture 20, Quiz 2
Lecture 21, Perspective Viewing
Lecture 22, Effective efficient lighting
Lecture 23, HTML5, javascript, CSS
Lecture 24, Windowing systems
Lecture 25, 3D with glasses and without
Lecture 26, Texture mapping in 3D, zoom glasses
Lecture 27, Color Scale
Lecture 28, Output Jpeg, PostScript
Lecture 29, Project Demonstrations and Review
Lecture 30, Final Exam
Lecture 31, More graphics math
Other Links
We will cover information on User Interface
The user interface includes visual and sound output.
There may be physical output when using a game controller.
The user interface includes keyboard, mouse, touch, multi-touch
and game controller input. Voice recognition may be available.
The desired output responce time from the time of an input
varies widely with application.
As various applications are covered, the differences in
Style, conventions and standards will be presented.
Application of User Interface
1) desktop, labtop, tablet computers
both application and web interface
Windows, Mac OSX, Unix, Linux differences
(Some demonstrations)
Notice how the user interfaces have changed with time.
Many Mac conventions have been adopted by Windows
and some Linux distributions.
Touch screens are becoming available and the
user interfaces are changing, some adopting
user interface similar to smart phones.
2) game consoles
WII, Playstation 3, XBox 360 (Playstation 4, Xbox One)
game controllers (some samples shown)
3) cell phones
touch methods, size, speed, resolution
One finger moving in place of scroll bar.
Two finger roatation in place of mouse motion for rotation.
Take into account "fat fingering" in addition to obvious
finger size and resolution.
4) Automotive, aircraft "glass cockpit"
replacing traditional instruments with a display
I am doing contract software in this area.
My part was the primary flight display that gets input
from the inertial measurement unit and Global Positioning
System, GPS. (Sample demo later when we cover motion)
5) RPV, remotely piloted vehicle
flying over Afghanistan from Colorado
This requires the aircraft "glass cockpit" plus
mapping and threat displays. Reaction time to
get aircraft information back to the displays
becomes a critical factor.
6) Internationalization
marketing around the world
Basically, do not put any text into graphics.
All text is pulled from a file or files so that translations
to other languages can be changed in the files rather
than changing many places in the application.
7) real 3D displays
cameras, games, TV, graphics
Real 3D is here both with and without glasses.
Processing and developing real 3D applications
is covered in several lectures.
This course will provide the student both
knowledge and a basic Graphical User Interface, GUI, program
that the student has written and can be expanded into
various applications the student wants to develop.
This is very broad and includes cell phone apps,
desktop, laptop, tablet applications, games for
either computer or game console, etc.
Building GUI programs is non-trivial yet rewarding.
The student needs to understand the operating system,
the windowing system and "tool kits."
There are many potential employment opportunities for
graduates with computer graphics skills. The film
industry and advertising industry have many types of
positions available. The gaming industry, with some
firms local to the Baltimore area, have various
positions available. Check out Firaxis, Breakaway,
Day 1 Studios, Big Huge Games and others.
Automotive and aircraft companies are using
GUI increasingly to add new capability and
replace old instrument displays.
Course motto: If it works, use it.
If not, find another way.
You will be dealing with windowing systems and graphical
libraries that are much larger and more complex than
operating systems. I guarantee they will have bugs.
Your grade depends of finding a way around any bugs.
Your program must work in spite of system/library bugs.
The basic prerequisite for this course is to be able to
write working code in some reasonable programming language.
You will probably be writing 1,000 to 10,000 lines of code
in this course. Do not panic. A lot of code is repetitive.
You are expected to know the software development cycle:
Edit <-----------+
Compile |
Run |
Curse ---+
As an acknowledged expert, Edsger Dijkstra, has stated:
"Top down design and programming is right every time
except the first time." For your rapid learning you
do not want to use the "waterfall model" or even
Barry Boehms "spiral model", but rather use
"rapid prototyping".
Do not worry about the details, for a while, yet look over
the organization and structure of the same GUI application
written for X Windows Motif, OpenGL, Java and Python.
Remember, putty is useless for graphics. Your desk top or
lap top should have Linux as dual boot in order to use
ssh -Y username@linux.gl.umbc.edu
You will need to make a choice of "platform" for doing
the programming for this course. My lectures will cover:
Microsoft Windows - Java, JavaScript (same code every where)
- Python, HTML5 etc (probably same code every where)
- OpenGL in C, C++ (same code for Linux and Mac OSX)
Linux, Unix - Java, JavaScript (same code every where)
- Python, HTML5 etc (probably same code every where)
- X Windows Motif (same code for Mac OSX)
- OpenGL in C, C++ (same code MS Windows and Mac OSX)
Mac OSX - Java, JavaScript (same code every where)
- Python, HTML5 etc (probably same code every where)
- X Windows Motif (same code for Linux, Unix)
- xcode, cocoa (Mac specific)
- OpenGL in C, C++ (same code for MS Windows and Linux)
etc - The adventurous student may use raw wx or Qt or Tk,
PyQt4, or other language and graphics tool kit.
Microsoft's C# and game software may be used.
HTML5 with JavaScript may be used.
3D graphics may be used.
Cell Phone - You may choose to do an app for your project
Game Console - You may choose to do a game for your project
On Microsoft Windows you need compilers and possibly
some graphics tool kit, or Java SDK, Python with graphics,
editor and browser using HTML5, either
Microsoft Visual Studio or Cygwin to do 3D.
On Linux, Unix you may need Motif (called Lesstif or OpenMotif) installed.
UMBC linux.gl.umbc.edu has all software installed. Java, Python,
editors and compilers and browsers for JavaScript and 3D.
The Firefox browser has HTML5 and JavaScript on all OS.
On Mac the underlying operating system is Unix. Thus you can
have Java, Python, compilers,
it is not already installed. You may also use the Mac IDE.
Java has two execution models. "Frame" makes standard applications
that run in a standard window on all platforms. "App" or applet is
much more restrictive and must run in a WEB browser or appletviewer.
Then you have a choice of using just AWT or additionally Swing
or Swing2 and optionally Java3D. Explore "java.sun.com".
"etc" becomes the students responsibility to set up the
environment and do the homework and project. Just running a
demo project is not acceptable. You must make significant
additions and changes.
HTML5, JavaScript, 3D and more are available in latest
web browsers. Be sure your system is up to date.
GUI Human factors: Make sure it is obvious to the user of your
application how to quit, exit, kill or stop.
Just a quick look at some sample code.
See which will run on your development system
w1.c basic X windows
w1.jpg - screen
w1gl.c - w1.c in OpenGL
w1gl.jpg - screen
W1frame.java - w1.c in Java
W1frame_java.png - screen
W1frame.jpg - screen
W1app.java - W1frame as an applet
hw1s.py - contributed Python2 wx Windows
w1tk.py - simple Python2 tk on GL
w1qt.py - simple Python2 pyqt on GL
w1wx.py - simple Python Windows wx
w1tk.py3 - simple Python3
shape_def.py3 source code
 shape_def3d.py3 source code
 shape_def3d_py3.out vertex,faces
w1.html - HTML5 using javascript
Many w1, w2, w3, w4 files with various languages
download file you want as filename on linux.gl.umbc.edu with
cp /afs/umbc.edu/users/s/q/squire/pub/download/filename
cp /afs/umbc.edu/users/s/q/squire/pub/www/filename .html files
app1qt4.py - contributed Python Qt
hw5qt4s.py - contributed Python qt clock
hw2wxs.py - contributed Python wx
3D HyprCube.java
run 3D HyprCube.html
http://www.cs.umbc.edu/~squire/myapplets/HyprCube.html
Note that:
w1.c, the basic X Windows GUI application can be compiled
and executed on all Unix based operating systems,
including MacOS X
w1gl.c, the OpenGL GUI application can be compiled
and executed on almost all operating systems
that provide windowing (All forms of Unix,
MacOS and Microsoft Windows, etc.)
W1frame.java, the Java GUI application can be compiled
and run on any system that has Java
J2SE 1.6, JDK 6 or later available.
W1app.java, the Java GUI application can be compiled
on any system that has Java J2SE 1.6 or
later available. Then run in almost any
WEB browser. But, the user may not have
Java applets enabled. There are also some
severe restrictions on applets. Also, JavaScript
and Flash may not work well for this course.
Other demonstrations of sample applications may include:
split_cube - visualization, color, movement, inside
f to slow, O to close, c no color, C color helps visualize, R/L click
Actually running split_cube6 x for demonstration
teapots - lighting, move light with arrow keys, beware background
planets - lighting and glowing sun
sky_fly - terrain
pilot - do your own flight simulator, y,z underground?
springgl - education, teach something for project
spring2gl - build on previous applications
alpha_fade - scene transitions using fading
earth - texture map pictures onto objects
gears4 - modeling and simulation
tenseg2gl - modeling user controls viewing
light_dat - skull.dat , more modeling
draw - default object oriented graphics (digital logic and circuit symbols added)
pairs2 - card game
hull_draw - modeling boat hull
mover - independent window control
fractal.c - create scenes (art vs composition)
fractalgl.c - create scenes (art vs composition)
Fractal.java - create scenes (art vs composition)
Now, you need to set up your system for GUI programming.
linux.gl.umbc.edu has everything for Linux X Windows,
OpenGL and java. You may have to download software or
set up links or change directory names on your Linux
or Unix system.
Microsoft Windows needs to have Microsoft Visual Studio
or Cygwin or possibly some free compilers. There are many
versions of Microsoft Visual Studio and thus they are
not covered in this course. The essential component is
"cl.exe" the C and C++ compiler that can be used from
a standard command prompt. If you use Visual Studio
be sure you turn off preference "precompiled header files".
Mac OSX, use either the Mac IDE or download the X environment.
More information is in getting started
That said, here are the Linux/Unix/Mac "Makefile" and the
Microsoft Windows "make.bat" files that compile and execute
the source code shown above.
Makefile1.linux
Makefile_mac_w1
make1.bat make1.bat.txt
In my personal directory, I have some Makefiles and
some make.bat files that includes all commands to make
most programs in that directory.
A start of my Makefile and make.bat is shown above.
An option to make.bat is to use nmake on Microsoft Windows.
(This is an optional exercise for the student.)
Or, use an IDE such as Visual Studio, Eclipse, etc. etc.
Now, a quick look forward to your project.
Start trying various OS, languages, and toolkits.
Do homework 1 fall
If you have been on WOW, World of Warcraft or angry birds or
other virtual worlds, you might note how they handle the human interface.
opensimulator.org is a
virtual environment builder that may be of interest.
This course in interested in the user interface. Both to
develop applications and to use applications.
Human factors, intuitiveness, speed of learning, levels of
expertise are of interest.
Add music or voice to make your interaction more interesting (uses flash):
words and music
copy any of my files that may interest you, on linux.gl.umbc.edu
cp /afs/umbc.edu/users/s/q/squire/pub/download/fileyouwant .
cp /afs/umbc.edu/users/s/q/squire/pub/www/w1.html .
Homework 1 is assigned hw1
A few sample programs in Python 3
w1tk.py3 source code
w2tk.py3 source code
shape_def3d_py3.out vertex,faces
w1.html - HTML5 using javascript
Many w1, w2, w3, w4 files with various languages
download file you want as filename on linux.gl.umbc.edu with
cp /afs/umbc.edu/users/s/q/squire/pub/download/filename
cp /afs/umbc.edu/users/s/q/squire/pub/www/filename .html files
app1qt4.py - contributed Python Qt
hw5qt4s.py - contributed Python qt clock
hw2wxs.py - contributed Python wx
3D HyprCube.java
run 3D HyprCube.html
http://www.cs.umbc.edu/~squire/myapplets/HyprCube.html
Note that:
w1.c, the basic X Windows GUI application can be compiled
and executed on all Unix based operating systems,
including MacOS X
w1gl.c, the OpenGL GUI application can be compiled
and executed on almost all operating systems
that provide windowing (All forms of Unix,
MacOS and Microsoft Windows, etc.)
W1frame.java, the Java GUI application can be compiled
and run on any system that has Java
J2SE 1.6, JDK 6 or later available.
W1app.java, the Java GUI application can be compiled
on any system that has Java J2SE 1.6 or
later available. Then run in almost any
WEB browser. But, the user may not have
Java applets enabled. There are also some
severe restrictions on applets. Also, JavaScript
and Flash may not work well for this course.
Other demonstrations of sample applications may include:
split_cube - visualization, color, movement, inside
f to slow, O to close, c no color, C color helps visualize, R/L click
Actually running split_cube6 x for demonstration
teapots - lighting, move light with arrow keys, beware background
planets - lighting and glowing sun
sky_fly - terrain
pilot - do your own flight simulator, y,z underground?
springgl - education, teach something for project
spring2gl - build on previous applications
alpha_fade - scene transitions using fading
earth - texture map pictures onto objects
gears4 - modeling and simulation
tenseg2gl - modeling user controls viewing
light_dat - skull.dat , more modeling
draw - default object oriented graphics (digital logic and circuit symbols added)
pairs2 - card game
hull_draw - modeling boat hull
mover - independent window control
fractal.c - create scenes (art vs composition)
fractalgl.c - create scenes (art vs composition)
Fractal.java - create scenes (art vs composition)
Now, you need to set up your system for GUI programming.
linux.gl.umbc.edu has everything for Linux X Windows,
OpenGL and java. You may have to download software or
set up links or change directory names on your Linux
or Unix system.
Microsoft Windows needs to have Microsoft Visual Studio
or Cygwin or possibly some free compilers. There are many
versions of Microsoft Visual Studio and thus they are
not covered in this course. The essential component is
"cl.exe" the C and C++ compiler that can be used from
a standard command prompt. If you use Visual Studio
be sure you turn off preference "precompiled header files".
Mac OSX, use either the Mac IDE or download the X environment.
More information is in getting started
That said, here are the Linux/Unix/Mac "Makefile" and the
Microsoft Windows "make.bat" files that compile and execute
the source code shown above.
Makefile1.linux
Makefile_mac_w1
make1.bat make1.bat.txt
In my personal directory, I have some Makefiles and
some make.bat files that includes all commands to make
most programs in that directory.
A start of my Makefile and make.bat is shown above.
An option to make.bat is to use nmake on Microsoft Windows.
(This is an optional exercise for the student.)
Or, use an IDE such as Visual Studio, Eclipse, etc. etc.
Now, a quick look forward to your project.
Start trying various OS, languages, and toolkits.
Do homework 1 fall
If you have been on WOW, World of Warcraft or angry birds or
other virtual worlds, you might note how they handle the human interface.
opensimulator.org is a
virtual environment builder that may be of interest.
This course in interested in the user interface. Both to
develop applications and to use applications.
Human factors, intuitiveness, speed of learning, levels of
expertise are of interest.
Add music or voice to make your interaction more interesting (uses flash):
words and music
copy any of my files that may interest you, on linux.gl.umbc.edu
cp /afs/umbc.edu/users/s/q/squire/pub/download/fileyouwant .
cp /afs/umbc.edu/users/s/q/squire/pub/www/w1.html .
Homework 1 is assigned hw1
A few sample programs in Python 3
w1tk.py3 source code
w2tk.py3 source code
 w3tk.py3 source code
 w4tk.py3 source code
w5tk.py3 source code
rubber_box.py3 source code
w4tk.py3 source code
w5tk.py3 source code
rubber_box.py3 source code
 colorw.py3 source code
Each student needs to choose an operating
system to which they have access.
Your version of operating system and toolkit may
be very different from examples below.
Ignore anything that does not apply to your system.

UMBC makes available computers running Microsoft Windows,
Linux, Solaris, MacOS and several others.
Students may configure and use their personal computers.
UMBC offers economical software through my.umbc.edu "business".

The "windowing" system is chosen by default from the operating
system choice. MS Windows, X windows or Macintosh.
In Unix/Linux operating systems the user has a choice of window
manager and possibly a choice of desktop. There may be a graphical
software development environment available. Students may use any
tools they have learned and like. This course can not hope to
cover all possible development environments. Thus, tested command
line instructions are provided that will work for this course.
Do not expect help from the instructor on other development
environments, they generally have a long learning curve and are
found to be marginally more productive that command line development.

In the chosen operating system, the student
should choose a programming language, "C", C++,
Java, python, or other that has available interface to OpenGL.

You may start by using a UMBC machine and getting sample files

 From any computer on the Internet that has "ssh" available

   ssh -X linux.gl.umbc.edu  (older systems)
   ssh -Y linux.gl.umbc.edu  (up to date systems)
   (then enter your UMBC username and password)

 Starter files may be copied to your subdirectory on
 GL  using commands such as (be sure to type the last space-dot):

 cp  /afs/umbc.edu/users/s/q/squire/pub/download/w1.c  .
 cp  /afs/umbc.edu/users/s/q/squire/pub/download/w1gl.c  .
 cp  /afs/umbc.edu/users/s/q/squire/pub/download/w1tk.py3  .
 cp  /afs/umbc.edu/users/s/q/squire/pub/download/W1frame.java  .
 cp  /afs/umbc.edu/users/s/q/squire/pub/download/W1app.java  .
 cp  /afs/umbc.edu/users/s/q/squire/pub/download/W1app.html  .
 cp  /afs/umbc.edu/users/s/q/squire/pub/download/Makefile1.linux  .

 *** currently on linux.gl.umbc.edu most students also need:
 cp  /afs/umbc.edu/users/s/q/squire/pub/download/libglut.so.3.7  .
 cp  /afs/umbc.edu/users/s/q/squire/pub/download/libXm.so.1  .
 ln -s libglut.so.3.7 libglut.so.3
 ln -s libglut.so.3.7 libglut.so
 cp  /afs/umbc.edu/users/s/q/squire/pub/download/Makefile_w1  .
 mkdir GL
 cd GL
 cp  /afs/umbc.edu/users/s/q/squire/pub/download/glut.h  GL
 setenv LD_LIBRARY_PATH .
 cd ..
 make -f Makefile_w1  w1gl
 *** the above is needed when GLUT and Motif are not installed


 type   make -f Makefile1.linux
        make -f Makefile1.linux java

 The java program runs upon typing the second command.
 Type   w1    to run the basic X Windows program.
 Type   w1gl  to run the OpenGL program.

 If you get a message about a missing  .so  file, you also need
        setenv LD_LIBRARY_PATH .
 in order for the ".so" shared object files to be found.


 On the old UMBC lab machine running MS Windows 2000, there was a lot more
 setup required. Here are the steps I needed to be able to use OpenGL
 with Glut. (do NOT type the (stuff) ) (J: may be S:)
 ((Or you may use  WinSCP, it works great for me.))

    log on    (I was in J:\umbc.edu\users\s\q\squire\home,
               you will be in your  /afs  directory)
    md cs437  (a special directory for this course)
    cd cs437  (be there)
    md GL     (needed for GLUT)
    cd GL     (be there)
    copy J:\umbc.edu\users\s\q\squire\pub\download\glut.h
    cd ..     (you are back in cs437)
    copy J:\umbc.edu\users\s\q\squire\pub\download\glut32.lib
    copy J:\umbc.edu\users\s\q\squire\pub\download\glut32.dll
    copy J:\umbc.edu\users\s\q\squire\pub\download\w1gl.c
    copy J:\umbc.edu\users\s\q\squire\pub\download\cl_setup.bat
    cl_setup  (you are running the .bat file)
    cl /GX /ML /I. w1gl.c
    w1gl

On Mac OSX you can use Cocoa, the native Mac graphics,
or use "fink" to download X Windows, Motif, possibly OpenGL
if not installed.
   Cocoa will look like
      #import
      #import "your_stuff.h"
      int main(int argc, char *argv[])
      {
        return NSAapplicationMain(argc,(const char *)argv);
      }

   or use the same command line commands as Linux, SunOS, or
   any version of Unix.

X11 that is X windows (Different from native Mac OSX windows) can be
run on any Mac OSX computer. Here is the Makefile I have used for w1, etc

  # Makefile_mac_w1 for CS437
  # after you have installed X windows, X11
  # e.g. using    /sw/bin/fink install
  # compile anywhere, execute in an X11, xterm

  CC=gcc
  CFLAGS= -I/sw/include -I/usr/X11R6/include
  LIBX= -L/usr/X11R6/lib  -L/sw/lib -lXext -lXm -lXt -lXi -lX11 -lm
  LIBGL= -L/usr/X11R6/lib -L/sw/lib -lGLw -lGL -lGLU -lglut
  LIBS=$(LIBGL) $(LIBX)

  all: w1 w2 w1gl w2gl

  w1: w1.c
	  $(CC) $(CFLAGS) -o w1 w1.c $(LIBS)

  w2: w2.c
	  $(CC) $(CFLAGS) -o w2 w2.c $(LIBS)

  w1gl: w1gl.c
	  $(CC) $(CFLAGS) -o w1gl w1gl.c $(LIBS)

  w2gl: w2gl.c
	  $(CC) $(CFLAGS) -o w2gl w2gl.c $(LIBS)


 Follow this link to Solve Setup Problems, Unix-Linux

 Follow this link to Solve Setup Problems, Microsoft
Do not expect you system to be set up for GUI programming.
You are now into the expert programmer realm.

You must be able to find out how your specific computer is configured.

Use the command    printenv | more   to see your environment.
Specifically look at some environment variables:
     echo $PATH     # direct access to executable programs
     echo $INCLUDE  # direct access to include files
     echo $LIB      # direct access to linking libraries

You can modify environment variables for your use using:
     set LIB=$LIB;/your-directory-path
     export LIB

 On some systems, X Windows and Motif may not be installed in default
 directories.  For these, use    find /usr  -name Xm.h -print
 to get the include directory,   CFLAGS= -I<path to directory>

    CFLAGS= -I/usr/X11R6/include

 Use    find /usr -name libXm\* -print
 to get the link directory,  LIBX= -L<path to directory>

    LIBX= -L/usr/X11R6/lib -lXm -lXt -lXi -lX11 -lm

 Then use expanded compile and link command in the Makefile
 tab gcc -o w1 $(CFLAGS) w1.c $(LIBS)

 To get X windows manual pages, you may need, in your .bashrc file

   set MANPATH=/usr/local/man:/usr/X11R6/man
   export MANPATH

 or in your .cshrc file

   setenv MANPATH /usr/local/man:/usr/X11R6/man

 OpenGL use requires access to the file  GL/gl.h
 and libgl.so or libgl.a

 For gl.h, use    find /usr  -name gl.h -print
 to get the include directory,   CFLAGS= -I<path to directory>
 (do not keep the trailing "/GL" in the "path to directory")

      CFLAGS= -I/web/www/help/C++/opengl/glut-3.7/include

 For libgl, use     find /usr -name libgl\* -print
 to get the link directory,  LIBGL= -L<path to directory>

      LIBGL= -L/usr/lib -lGLw -lGL

 glut use requires access to the file  GL/glut.h
 and libglut.so or libglut.a

 For glut.h, use    find /usr  -name glut.h -print
 to get the include directory,   CFLAGS= -I<path to directory>
 (do not keep the trailing "/GL" in the "path to directory")

 For libglut, use     find /usr -name libglut\* -print
 to get the link directory,  LIBGL= -L<path to directory>

      LIBGL= -L/usr/lib -lGLw -lGL -lGLU

 There may be systems where links may be missing in /usr/lib
 On one system, it was necessary, to specifically include the
 ".so" file

    LIBGL= /usr/lib/libglut.so.3 -lGLw -lGL -lGLU


 Combine library information using:

      LIBS=$(LIBGL) $(LIBX)

 Then compile using:

      gcc -o w1 $(CFLAGS) w1.c $(LIBS)

You may want to use the Perl Script below to set up a UMBC lab
computer running Linux to have a friendly environment:

  Be in a UMBC computer lab, booted up in Linux. Be in your cs437 directory.
  ssh linux.gl.umbc.edu   # log in, cd to your cs437 directory
                            do above to get w1.c, w2gl.c, Makefile1
  cp /afs/umbc.edu/users/s/q/squire/pub/download/oglsetup.pl.txt  .
  mv oglsetup.pl.txt oglsetup.pl
  ./oglsetup.pl
  1
                   this should set up a directory and links, if successful:
  ./oglsetup.pl
  2
  Makefile1
                   this augments Makefile1
  ^D               log off linux.gl.umbc.edu back to lab machine
  make
                   This should compile, without error, w1.c and w1gl.c
  w1               # run w1
  w1gl             # run w1gl  if it does not work, read the Pearl script
Do not expect you system to be set up for GUI programming.
You are now into the expert programmer realm.


Use the command    set | more   to see your environment.
Specifically look at some environment variables:
     echo %PATH%     # direct access to executable programs
     echo %INCLUDE%  # direct access to include files
     echo %LIB%      # direct access to linking libraries

You can modify environment variables for your use using:
     set LIB=%LIB%;S:\your-directory-path

 On some systems, OpenGL and glut may not be installed in default
 directories. If not, just copy the needed files to the required
 directories. The assumption is that Microsoft Visual Studio is
 installed. This is not free software and must be purchased in
 order to have a C and C++ compiler and associated libraries.

 The following shows the directories and the necessary files:
 (uppercase is the same as lowercase on Microsoft)
 (replace Microsoft Visual Studio\VC98 with
          Microsoft Visual Studio .NET 2003\VC7\PlatformSDK
          Microsoft Visual Studio .NET\VC7\PlatformSDK
          Microsoft Visual Studio 9.0\VC
  for various versions)

 C:\Program Files\Microsoft Visual Studio\VC98\include\GL\gl.h
 C:\Program Files\Microsoft Visual Studio\VC98\include\GL\glaux.h
 C:\Program Files\Microsoft Visual Studio\VC98\include\GL\glu.h
 C:\Program Files\Microsoft Visual Studio\VC98\include\GL\glut.h

 C:\Program Files\Microsoft Visual Studio\VC98\lib\opengl32.lib
 C:\Program Files\Microsoft Visual Studio\VC98\lib\glu32.lib
 C:\Program Files\Microsoft Visual Studio\VC98\lib\glaux.lib
 C:\Program Files\Microsoft Visual Studio\VC98\lib\glut32.lib

 C:\Windows\System32\opengl32.dll
 C:\Windows\System32\glu32.dll
 C:\Windows\System32\glut32.dll

You can get these files, if not on your system, from
 /afs/umbc.edu/users/s/q/squire/pub/download

 basically 7 files  glut32 and opengl32  for   .lib  and   .dll
              and   gl.h  glut.h  glu.h

If you are not set up for Command Prompt "C" programming, you need
to set up Environment Variables

  Mouse your way to  Control Panel     on your computer
                       System
                         Advanced
                           Environment Variables

  You have a choice of "user variables " just for current user
  or                   "system variables" apply to all users

  Check or add for appropriate version:
      lib       ;C:\Program Files\Microsoft Visual Studio\VC98\lib
      lib       ;C:\Program Files\Microsoft Visual Studio .NET 2003\VC7
                                                       \platformSDK\lib
      lib       ;C:\Program Files\Microsoft Visual Studio 9.0\VC\lib

      include   ;C:\Program Files\Microsoft Visual Studio\VC98\include
      include   ;C:\Program Files\Microsoft Visual Studio .NET 2003\VC7
                                                   \platformSDK\include
      include   ;C:\Program Files\Microsoft Visual Studio 9.0\VC\include

      path      ;C:\Program Files\Microsoft Visual Studio\VC98\bin
      path      ;C:\Program Files\Microsoft Visual Studio\VC7\bin
      path      ;C:\Program Files\Microsoft Visual Studio 9.0\VC\bin

                (Concatenate, separating them by a semicolon, ;)

To set your environment variable on GL for a UMBC lab machine:
  Right click on "my computer" click on properties,
                                            advanced,
                                              environment variables.

Note: There may be a \Microsoft Visual Studio .net\ (no 2003 )

To find missing or misplaced  .dll  files
  cd \
  dir /s mspdb71.dll   (this is an example, probably not found)
  dir /s mspdb80.dll   (for visual studio 9.0)

Then copy the misplaced  .dll  to  \windows\system32
(it is safe to add  .dll  files to \windows\system32 but suggest not overwrite)

  Now use a Command Prompt window to compile

       cl /GX /ML w1gl.c

  Then execute the program

        w1gl

  You may use "nmake" on Microsoft, similar but not quite the same
  as "make" or "gmake" on Unix-Linux

Note: When in command prompt window, the two commands:

      cd \
      dir /s opengl32.lib

      will tell you if you have OpenGL and where the "lib" is

      dir /s cl.exe   will tell you the "path" to the compiler

      dir /s gl.h     will tell you where its "include" directory is.

You will probably have to add glut.h in directory with gl.h
You will probably have to add glut32.lib in directory with opengl32.lib
You will probably have to add glut32.dll in \windows\system32
         or in working directory

Setup is a one time effort per machine per operating system.

Windows XP commands are command.help

Microsoft C and C++ compiler options are cl.help

Remember: Microsoft came after Unix and copied much.
          Unix command line works in Microsoft command window
          prog < data    redirection of file 'data' to stdin
          prog > reslt   redirection of stdout to file 'reslt'
          prog | more    pipe output through 'more' same as Unix
          prog -help     often both /option and -option are allowed
          "root" and directories are forward slash on Unix
          "root" and directories are backward slash on Microsoft
          some tools accept both " / " and " \ " on Microsoft, WWW, FTP, etc.
          Microsoft 'nmake' much line Unix 'make' or 'gmake'
          "C", "C++", Java, etc languages same on both.
          Microsoft is case insensitive file system, thus
          use all lower case in programs for compatibility.
          e.g. #include <stdio.h>  /* include path */
               #include "your.h"         /* local directory */
               fopen("my_file.stuff", "r");
          Both take long file names. No more 8.3 restriction.
          Both allow spaces but save the headache, use underscore, _.
          Both use environment variables and substitution in scripts.

Know and use tools to help yourself be efficient.
You many wish to keep old versions of programs (renamed or in separate
directories) and use  "diff" on Unix, "fc" on MS Windows to find
the DIFFerences using a File Compare tool.
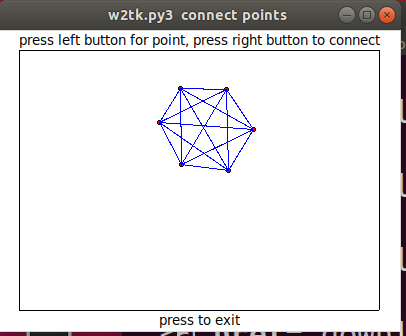
An extension of the very basic w1.c is to use the mouse to
select points, then connect the points with lines.
You may download these programs, changing "1" to "2" in
the 'cp' commands in lecture 1.
cp /afs/umbc.edu/users/s/q/squire/pub/download/w2.c
cp /afs/umbc.edu/users/s/q/squire/pub/download/w2gl.c
cp /afs/umbc.edu/users/s/q/squire/pub/download/W2frame.java
cp /afs/umbc.edu/users/s/q/squire/pub/download/w2tk.py3
cp /afs/umbc.edu/users/s/q/squire/pub/download/rubber_box.py3
scp /afs/umbc.edu/users/s/q/squire/pub/download/wxmouse.py : C:\home
Modify the Makefile1.linux by copying the groups of lines and
also changing "1" to "2" in the copied lines.
After running the programs, look through the source code to
see how the mouse is handled (in a number of places!).
3D select will be covered in Lecture 11.
w2.c connect points X windows
w2gl.c - w2.c in OpenGL
W2frame.java - w2.c in Java
W2app.java - W2frame as an applet
w2tk.py python - in Python2 Tk
w2tk.py3 python3 - in Python3 tk
test_mouse.py python2 Tk basic mouse
test_mouse_py.out python2 output
test_mouse.py3 python3 tk basic mouse
test_mouse_py3.out python3 output
wxmouse.py python wx basic mouse on Windows
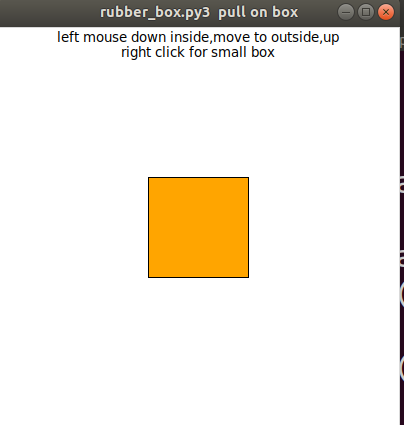
rubber_box.py3 python3 - in Python3 tk
One common GUI for the user to place objects at a position
with a user chosen size is to draw a "rubber band" rectangle.

This GUI feature uses "mouse motion" and typically has
the user first select the object to be placed, then press
and hold left mouse button down. The start coordinate is recorded
on the button down, the rectangle is displayed stippled (dashed)
while the user moves the mouse, then the end coordinate is
recorded on the button up.

Most systems provide a three button mouse with the buttons
labeled left, middle and right or 1, 2 and 3.  Any of the buttons
may be used for any action, yet users expect the left button to
be used for the most common actions.

First the code is shown for just showing the rubber band
rectangle.
rubber.c Xlib code
rubbergl.c GL code
Rubber.java Java code

Next the code is augmented to draw rectangles and do
selections. Now the code leaves a red rectangle when the
mouse button comes up. Note: "select" is also available.
With multiple rectangles on the scene, left click in one
rectangle, then another. Note that the selected "object" is
changed to green color.
rubber1.c Motif code
rubber1gl.c GL code
Rubber1.java Java code

An option is to have a grid and snap to grid.
The grid is always on in this example, yet should be under menu
control (grid spacing, snap, hide, etc. as shown in "draw" demo.)
I consider a grid essential on a mouse input GUI.
rubber2.c Motif code
rubber2gl.c GL code
Rubber2.java Java code
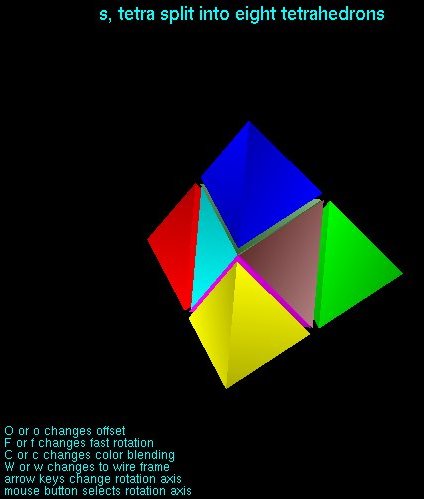
Visual Effects, visual understanding
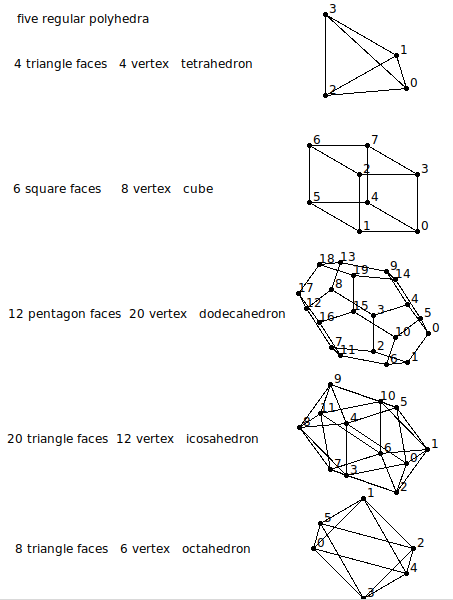
The program split_cube.c shows
a solid cube that is made up of five (5) tetrahedrons.
This would be hard to visualize without some considerations:
1) In order to see how the cube is constructed, an offset is provided.
("O" for larger offset, "o" for smaller offset, down to zero)
Note: at very small or zero offset, it is hard to understand how
the cube is built.
2) In order to see how the cube is constructed, the viewer may
change the axis of rotation (from the present orientation).
(Mouse press left, mouse press right, switches axis of rotation.
If there is a middle mouse button, that also switches the axis
of rotation.)
Note: In this example, almost every axis of rotation provides
a lot of information.
3) In order to see how the cube is constructed, the color of
adjacent faces are made unequal. This is accomplished by
slightly changing the color of the vertices of the triangles
that make up the faces of the tetrahedrons.
("C" for larger contrast, "c" for smaller contrast, down to zero)
Note: at very small or zero color contrast, it is hard to
understand the shape of the rotating objects.
4) In order to see how the cube is constructed, the speed
of rotation must be reasonable for the viewer.
A static image does not convey all the information about
how the cube is constructed.
("F" for faster rotation, "f" for slower, down to zero)
Note: at very small or zero rotation, it is hard to
understand the shape of the rotating objects.
5) In order to see how the cube is constructed, a wireframe
can be displayed for the viewer.
The wireframe shows edges of polyhedrons. It this case,
the five tetrahedrons, each with unique color edges.
("W" for wireframe, "w" for solid)
Note: That the edges merge and only one color is
displayed with the offset goes to zero.
Experiment with rotations (speed and direction), color shade,
offsets, and wireframe vs solid. Consider what information
your viewers need from your application. Provide the appropriate
user interface.
Then try split_cube6.c run from
the command line with split_cube6 -x
Unrecognizable, thus slow it down with f's. Change rotation with mouse
and open it up with uppercase O's. Deepen colors with uppercase C.
Two dimensional static pictures do not have the visualization
capability of user movable and colorable objects.
Similarly, for a tetrahedron:
split_tetra2.c
 A classic demonstration, that measures frames per second,
is gears.c Compile and run
this demonstration. Note use of either letter keys
'x' 'y' 'z' or arrow keys.
A classic demonstration, that measures frames per second,
is gears.c Compile and run
this demonstration. Note use of either letter keys
'x' 'y' 'z' or arrow keys.
Human Factors considerations

These are very loose time estimates and there is significant
variation from person to person, yet the concepts are worth
covering.

Human beings are very slow compared to computers in many
situations. But, human beings get very impatient if the
computer does not respond in a timely manner.

What is timely?

A person sees an event and must take action. Here is
the approximate time line:
1/10 second to "see" or recognize the event.
1/10 second to make a decision to take action
1/10 second to physically move a finger (e.g. press a key)

Thus, the fastest a person can respond to a "message" on a
computer screen is three tenths of a second.

A person presses a key and expects a response from the computer.
The person needs at least 1/10 second to "see" that there is
a response. Another 1/10 second to "understand" the response.
There seems to be some dead time between the key press and
expecting to "see" the response. Experiments have been conducted
and found, on average, that a computer response within one-half
second did not slow down most users. A few users could tell the
difference between two tenths of a second response and three
tenths of a second response. On a modern computer with multiple
pipelines and a 3GHz clock, about one billion instructions can
be executed in one tenth of a second.

There is a tradeoff that the GUI programmer has to make.
For rapid response activities, low quality images may be
needed and may be acceptable. For activities where the user
is creating, more quality may be needed and slower response
may be acceptable. For example, OpenGL lines are limited to
square ends while basic X Windows and Microsoft Windows allow
options for round ends and lengthen by one-half line width
in order to provide a smooth sequence of connected lines.

Consider a fast typist. Assume a person who can type 50 words
per minute. The definition of a word is five characters and a space.
Thus, 300 key presses per minute or 5 key presses per second.
But, that only allows two  1/10 second time periods per character.
Thus, the typist is multiplexing, reading ahead, selecting keys,
and pressing keys overlapped in time.

Color is in the category of "in the eyes of the beholder".
There is a good reason why American traffic lights have
red on top, yellow in middle and green on bottom as a standard.
There are many forms of "color blind" and thus the standard
position with each color emitting light is the "event" that
a driver senses. For GUI programming, file menu on the left and
help menu on the right is a defacto standard for the same
reason. Users are more efficient, and happy, when they spend
less time hunting for what they need.

Common color issues are red appearing as grey, green and
blue indistinguishable, etc. The GUI programmer can avoid
these concerns by using intensity to create contrast.
Rerun split_cube using "c" held down, then "C" held down, repeat,
to see the visual effect.


User interface speed comparing MAC OSX and Windows XP was measured
and reported in UIF_Report.pdf
The term "User Interface Friction" means friction that slows
down the user. This varies with user capability.
I call it fluff vs. function.

Let the user know what will happen

Give the user feedback

On line are many helpful hints on user interface design.
I like JJ Garrett's wisdom as given in his nine pillars of
successful web teams: It is competent people in each of these
nine areas that are more important than rolls, job descriptions,
tools or process. Then, in his elements of user experience where
he asks: "What do you expect to happen if you click there."
"Think visually." Does the user get positive feedback to know
the expected action happened? Consider a person setting a
new alarm clock for the first time. Is it really set? Might I
miss my important meeting tomorrow morning?


For students using Microsoft Windows, on linux.gl.umbc.edu
download from
/afs/umbc.edu/users/s/q/squire/pub/download
glut32.lib
glut32.dll
opengl32.lib
opengl32.dll
glut.h
opengl.h
Then copy these files to your Windows laptop in cs437 folder.
Create a sub folder named GL. Into that folder
download and copy gl.h glu.h
You need a "C" compiler, e.g. visual studio.
(my executables still ran in Windows 10)
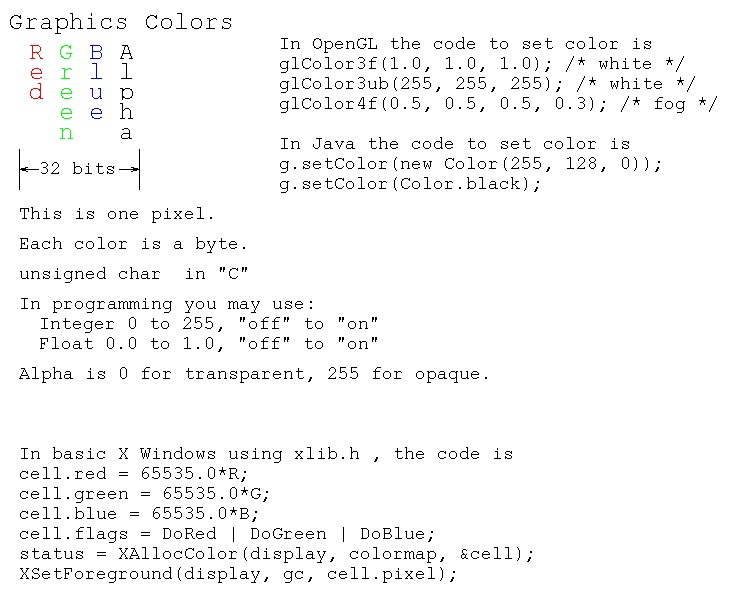
With pigment paint, the "primary colors" are red, blue and yellow.
With electronic displays the "primary colors" are red, green and blue.
The program Jcolor.java uses the built in names for colors and
lists the numeric values that correspond to the red, green and blue
color components. The output of Jcolor.java is:
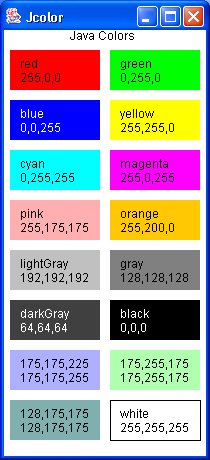 Notice that each color has a group of three numbers that represent
the amount of red, green and blue, hereafter referred to as RGB.
RGB = 0,0,0 is black, no color.
RGB = 255, 255, 255 is white, all color.
RGB = 255,0,0 is red.
RGB = 0,255,0 is green.
RGB = 0,0,255 is blue.
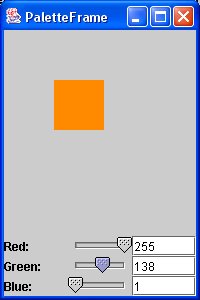
A more complicated Java program consists of three files that need
to be compiled, gives the user "sliders" to choose a color.
The Red, Green and Blue components can be selected independently.
MyColorChooser.java
DrawPanel.java
PaletteFrame.java
in Python3
color_chooser.py3 source code
an optional Java applet is:
PaletteApp.java
PaletteApp.html
A sample of PaletteFrame output is:
Notice that each color has a group of three numbers that represent
the amount of red, green and blue, hereafter referred to as RGB.
RGB = 0,0,0 is black, no color.
RGB = 255, 255, 255 is white, all color.
RGB = 255,0,0 is red.
RGB = 0,255,0 is green.
RGB = 0,0,255 is blue.
A more complicated Java program consists of three files that need
to be compiled, gives the user "sliders" to choose a color.
The Red, Green and Blue components can be selected independently.
MyColorChooser.java
DrawPanel.java
PaletteFrame.java
in Python3
color_chooser.py3 source code
an optional Java applet is:
PaletteApp.java
PaletteApp.html
A sample of PaletteFrame output is:
 In programming there is usually an alternative floating point
RGB with the color components in the range 0.0 to 1.0 equivalent
to 0 to 255. 0 is transparent, 1.0 or 255 is opaque.
A fourth component "Alpha", A, opacity can be present making
the RGBA of a pixel.
In programming there is usually an alternative floating point
RGB with the color components in the range 0.0 to 1.0 equivalent
to 0 to 255. 0 is transparent, 1.0 or 255 is opaque.
A fourth component "Alpha", A, opacity can be present making
the RGBA of a pixel.
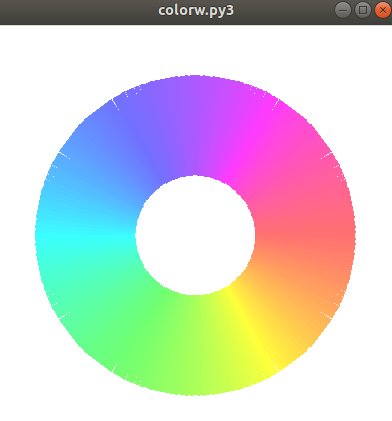
 A sample of X Windows coding of a colorwheel is colorw.c uses calculated values for colors. The output is
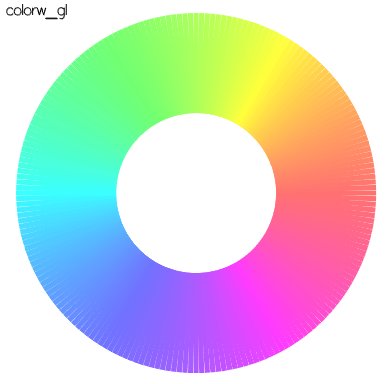
 A sample of OpenGL coding of a colorwheel is colorw_gl.c
Note: calculated values for colors. The output is
A sample of OpenGL coding of a colorwheel is colorw_gl.c
Note: calculated values for colors. The output is
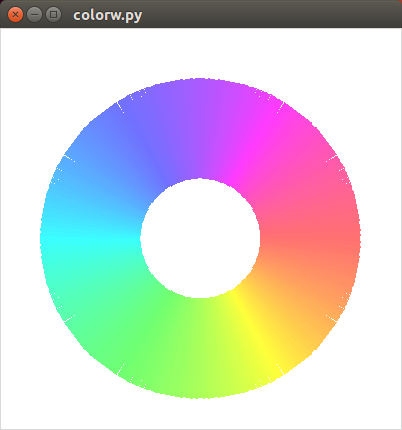
 A sample of python coding of a colorwheel is colorw.py
Note: calculated values for colors. The output is
in Python3
colorw.py3 source code
A sample of python coding of a colorwheel is colorw.py
Note: calculated values for colors. The output is
in Python3
colorw.py3 source code
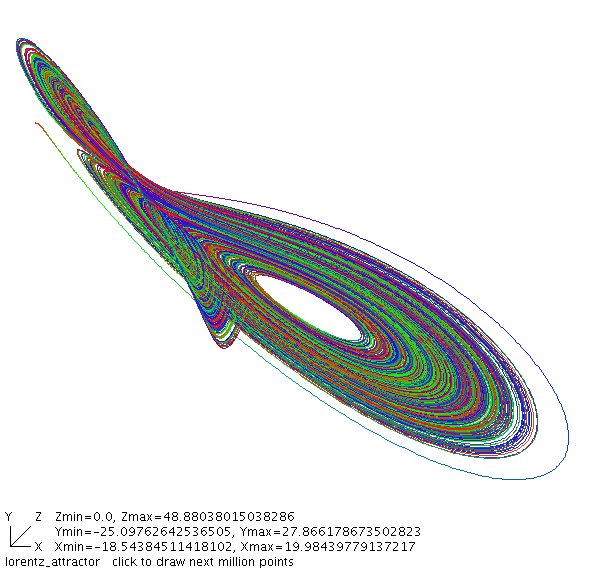
 A sample of Java coding of dynamic changing colors is lorentz_attractor.java
Note: different calculated values for colors.
Execute code.
The first output is
A sample of Java coding of dynamic changing colors is lorentz_attractor.java
Note: different calculated values for colors.
Execute code.
The first output is
 X Windows defines names for many more color names than Java,
these are available in rgb.txt
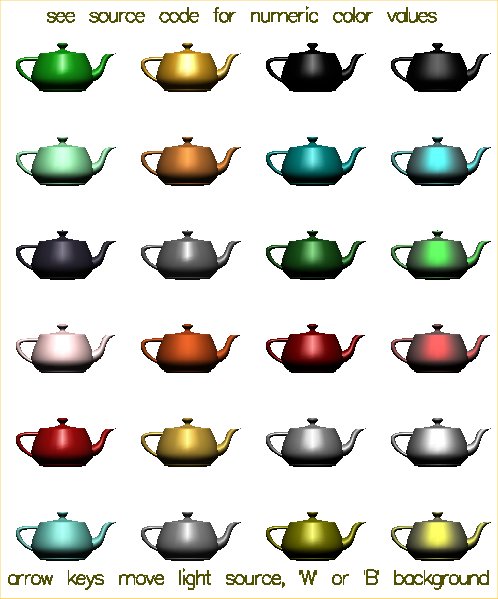
Colors are used in combination with lighting to fool the eye into
seeing various textures. teapots.c renders the
Utah Teapot with various colors and surfaces to provide the image.
10 values are used for each surface: Ambient RGB, Diffuse RGB,
Specular RBG and shine. See numeric values below renderTrapot.
X Windows defines names for many more color names than Java,
these are available in rgb.txt
Colors are used in combination with lighting to fool the eye into
seeing various textures. teapots.c renders the
Utah Teapot with various colors and surfaces to provide the image.
10 values are used for each surface: Ambient RGB, Diffuse RGB,
Specular RBG and shine. See numeric values below renderTrapot.
 There are many formats for graphics files. Two of the most common used
on the WWW are .gif and .jpg, Gif and Jpeg image files. Most graphics
formats can be converted to most other graphics formats. A common program
used for modifying images and changing formats is Paint Shop Pro. A free
version of this program may be downloaded form the WWW for MS Windows.
A similar program for Linux is Gimp which comes with many Linux
distributions and may also be freely downloaded.
Images may be scanned, captured from the WWW and created using a graphics
editor. In order to use graphics in your application program, you need
to be able to read the specific file format. Two demonstration programs
alpha_fade.c and alpha_fade2.c
are provided with respective files gifread.c and
jpegread.c
These demonstration programs read four .gif or .jpg files and also
demonstrate the use of "Alpha" to fade from one image to the next.
An example deck of cards as .gif files with an OpenGL display program
is in the directory download/cards_gif
The program card_gl.c that uses gif.h and
gifread.c displays and shuffles the deck to display card_gl.jpg
An example deck of cards as .xbm files with an OpenGL display program
is in the directory download/cards_xbm
The program cards_gl.c that uses
xbmread.c displays and shuffles the deck to display cards_gl.jpg
An example Java program to display .gif .jpg and .png files is
ImageDisplay.java
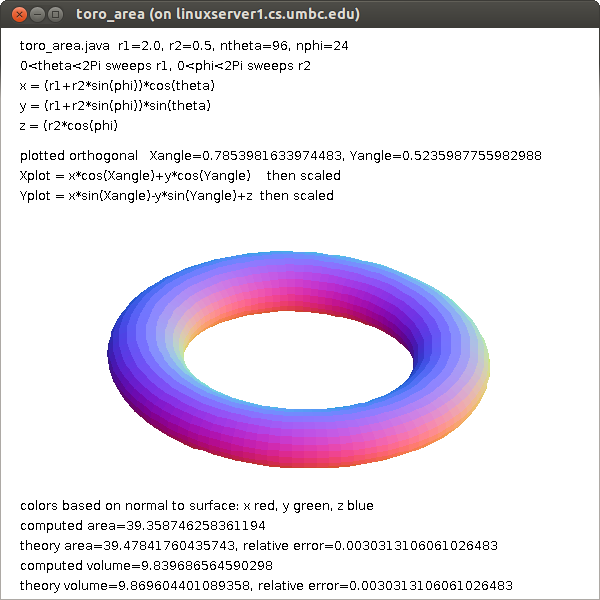
An example of using color on a 3D rendered object, toroid
toro_area.java
There are many formats for graphics files. Two of the most common used
on the WWW are .gif and .jpg, Gif and Jpeg image files. Most graphics
formats can be converted to most other graphics formats. A common program
used for modifying images and changing formats is Paint Shop Pro. A free
version of this program may be downloaded form the WWW for MS Windows.
A similar program for Linux is Gimp which comes with many Linux
distributions and may also be freely downloaded.
Images may be scanned, captured from the WWW and created using a graphics
editor. In order to use graphics in your application program, you need
to be able to read the specific file format. Two demonstration programs
alpha_fade.c and alpha_fade2.c
are provided with respective files gifread.c and
jpegread.c
These demonstration programs read four .gif or .jpg files and also
demonstrate the use of "Alpha" to fade from one image to the next.
An example deck of cards as .gif files with an OpenGL display program
is in the directory download/cards_gif
The program card_gl.c that uses gif.h and
gifread.c displays and shuffles the deck to display card_gl.jpg
An example deck of cards as .xbm files with an OpenGL display program
is in the directory download/cards_xbm
The program cards_gl.c that uses
xbmread.c displays and shuffles the deck to display cards_gl.jpg
An example Java program to display .gif .jpg and .png files is
ImageDisplay.java
An example of using color on a 3D rendered object, toroid
toro_area.java
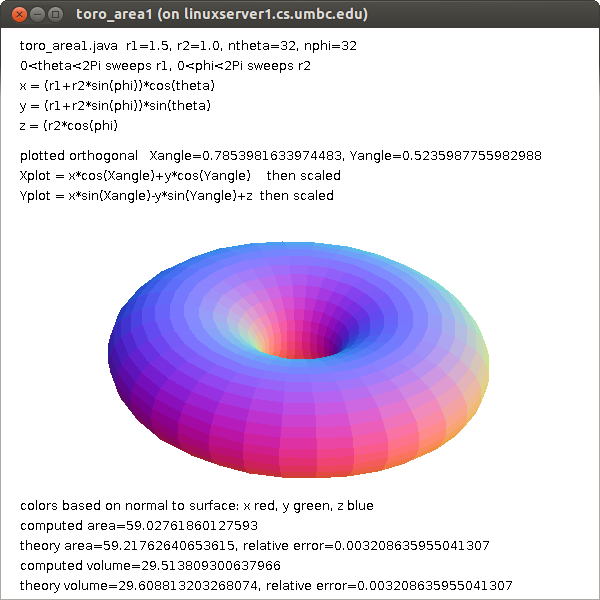
 toro_area1.java fewer points
 Many other graphics formats can be read. Some have code available on the WWW
but some you may have to write your own code to read the format. The basic
structure of graphic image files is a header with information about the
image such as height and width in pixels. Then there is generally a
Color Table, often coded as "ct". The basic idea is to have a set of colors,
a set of RGB's, stored in a table and then use one unsigned byte for
each pixel. The value in the unsigned byte is an index into the Color Table.
The terminology is that a color table with RGB components of eight bits
has 24 bits for each color or 2^24, over 16 million, possible colors.
The Color Table may have a maximum of 256 entries, called the pallet,
for this particular image. An unsigned byte can index from 0 to 255 thus
selecting one of the 256 colors in the pallet for each pixel.
Some graphics image formats allow compression such that the original
image is not exactly reproduced yet can look acceptable. This saves on
disk space and computer input/output time yet uses more CPU time.
But, in your application program, each pixel is usually stored as
a 32 bit word, RGBA. Note that OpenGL texture mapping files are stored
just as they would appear in RAM in your application. X Windows
bitmap files, d13.xbm ,
are actually "C" header files d13.xbm as text with the bits
encoded as hexadecimal. The .xbm files can be read at execution time
or included with "#include". For use in OpenGL use xbmread.c as
tested in xbm_to_gl.c
Each pixel in the .xbm file is on or off. The user specifies the
foreground and background color.
Just basic colors are not enough to get good looking graphics.
Shading across each, usually small, polygon provides the finishing
touch.
The subject of "lighting" will be covered in a future lecture.
Gouraud shading interpolates the colors at the vertices across the polygon.
Phong specular shading interpolates the normal vector at the vertices
across the polygon. More will be discussed on lighting in a later lecture.
If you have a color image and need to get a gray scale image,
the standard conversion is to make each RGB color have the value
0.299 * R + 0.587 * G + 0.114 * B
Remember 1.0 is white and 0.0 is black. When R equals G equals B then
you have a shade of gray.
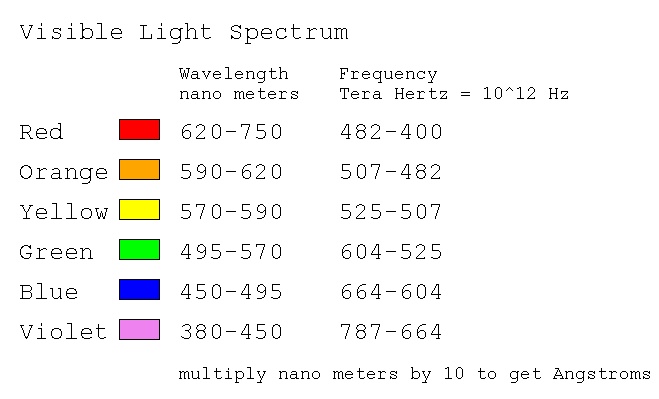
The "visible" spectrum, that which can be seen by average people,
is roughly given by wavelength in nm = nanometer or 10^(-9) meter.
Many other graphics formats can be read. Some have code available on the WWW
but some you may have to write your own code to read the format. The basic
structure of graphic image files is a header with information about the
image such as height and width in pixels. Then there is generally a
Color Table, often coded as "ct". The basic idea is to have a set of colors,
a set of RGB's, stored in a table and then use one unsigned byte for
each pixel. The value in the unsigned byte is an index into the Color Table.
The terminology is that a color table with RGB components of eight bits
has 24 bits for each color or 2^24, over 16 million, possible colors.
The Color Table may have a maximum of 256 entries, called the pallet,
for this particular image. An unsigned byte can index from 0 to 255 thus
selecting one of the 256 colors in the pallet for each pixel.
Some graphics image formats allow compression such that the original
image is not exactly reproduced yet can look acceptable. This saves on
disk space and computer input/output time yet uses more CPU time.
But, in your application program, each pixel is usually stored as
a 32 bit word, RGBA. Note that OpenGL texture mapping files are stored
just as they would appear in RAM in your application. X Windows
bitmap files, d13.xbm ,
are actually "C" header files d13.xbm as text with the bits
encoded as hexadecimal. The .xbm files can be read at execution time
or included with "#include". For use in OpenGL use xbmread.c as
tested in xbm_to_gl.c
Each pixel in the .xbm file is on or off. The user specifies the
foreground and background color.
Just basic colors are not enough to get good looking graphics.
Shading across each, usually small, polygon provides the finishing
touch.
The subject of "lighting" will be covered in a future lecture.
Gouraud shading interpolates the colors at the vertices across the polygon.
Phong specular shading interpolates the normal vector at the vertices
across the polygon. More will be discussed on lighting in a later lecture.
If you have a color image and need to get a gray scale image,
the standard conversion is to make each RGB color have the value
0.299 * R + 0.587 * G + 0.114 * B
Remember 1.0 is white and 0.0 is black. When R equals G equals B then
you have a shade of gray.
The "visible" spectrum, that which can be seen by average people,
is roughly given by wavelength in nm = nanometer or 10^(-9) meter.
 Color can be used in place of numeric data. This may require
the observer to have some understanding of the color coding.
Here is one sample of representing complex numbers with color:
Color can be used in place of numeric data. This may require
the observer to have some understanding of the color coding.
Here is one sample of representing complex numbers with color:
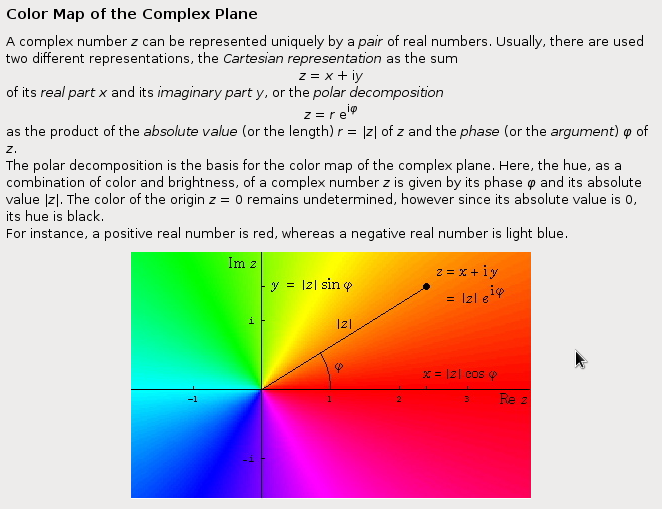 Notice that the colors are close to the color wheels above
in angle phi. I would have made the intensity change as
a function of |z|.
The RGB color space is called an "additive color space."
The CMYK, Cyan, Magenta, Yellow, black, color space is used for
printing and is called a "subtractive color space."
An approximate conversion, because every ink is unique, is
C1 = 1.0-R
M1 = 1.0-G
y1 = 1.0-B
K = min(C1, M1, Y1);
C = C1-K
M = M1-K
Y = Y1-K
TV uses an YIQ, luminance, inphase, quadrature, color space.
The matrix conversion is
|Y| |0.299 0.587 0.114| |R|
|I| = |0.596 -0.275 -0.321| * |G|
|Q| |0.212 -0.528 0.311| |B|
Notice that Y, luminance, is the gray scale formula, for black and
white TV. The IQ provide the color for color TV.
The CMYK and YIQ are smaller color spaces than RGB, some RGB
combinations are not representable.
Notice that the colors are close to the color wheels above
in angle phi. I would have made the intensity change as
a function of |z|.
The RGB color space is called an "additive color space."
The CMYK, Cyan, Magenta, Yellow, black, color space is used for
printing and is called a "subtractive color space."
An approximate conversion, because every ink is unique, is
C1 = 1.0-R
M1 = 1.0-G
y1 = 1.0-B
K = min(C1, M1, Y1);
C = C1-K
M = M1-K
Y = Y1-K
TV uses an YIQ, luminance, inphase, quadrature, color space.
The matrix conversion is
|Y| |0.299 0.587 0.114| |R|
|I| = |0.596 -0.275 -0.321| * |G|
|Q| |0.212 -0.528 0.311| |B|
Notice that Y, luminance, is the gray scale formula, for black and
white TV. The IQ provide the color for color TV.
The CMYK and YIQ are smaller color spaces than RGB, some RGB
combinations are not representable.
Sound and action
Action and music enhance interest
Composition may add beauty
For adding sound into your project, search Google.
A sample for java is ClipPlayer.java
and driver program ClipPlayerTest.java .
Record your own sound clips with a microphone and possibly
free download software. Also, Python and other tool kits:
sound.py plays sound files, needs WX
rocky4.wav test file
kirk.wav test file
ok.wav test file
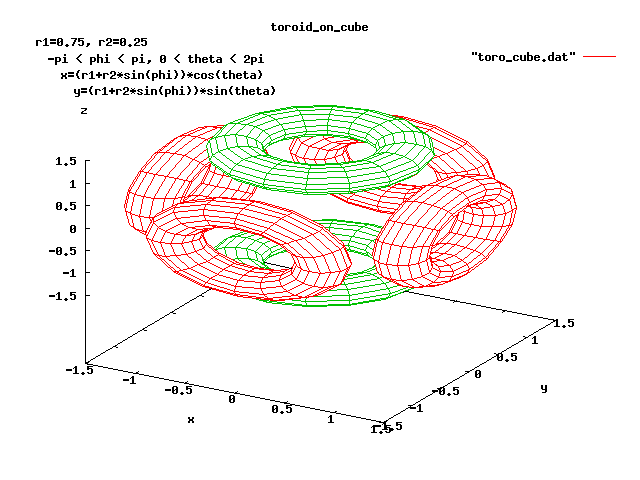
Using copies of your work
Once you have a shape you like, you may make copies.
toro_cube.c uses gnuplot and gimp
toro_cube.sh run gnuplot
toro_cube.plot run gnuplot control
toro_cube_c.out: toro_cube.c # makefile
gcc -o toro_cube toro_cube.c -lm
./toro_cube > toro_cube_c.out
rm -f toro_cube
./toro_cube.sh # on toro_cube.dat using gnuplot
./gimp toro_cube.png
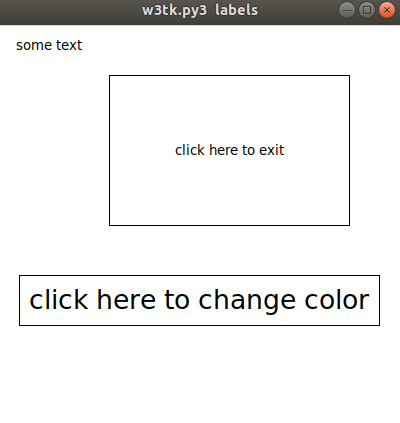
w3 sample code
W3frame.java source code
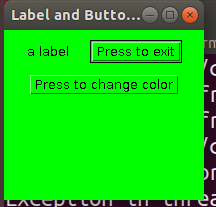 after Press to change color
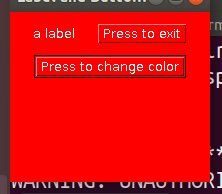 w3tk.py3 source code
tkmouse.py3 source code
w3tk.py3 source code
tkmouse.py3 source code
Motion can be useful and impressive.
If your program must do a lot of computation for each movement,
you will need to "double buffer". With double buffering your
program is building the next screen in RAM while the previous
screen is seen by the user. Then the buffers are swapped and the
user sees the new screen and your program builds the next
screen in the other RAM buffer.
Examples to be demonstrated:
2D
single_double.c - buffers in OpenGL (motion)
(also multiple windows)
You may see redraw if not double buffered.
3D
split_cube.c - speed control (motion)
split_cube6.c - speed control (motion)
robot2.c - connected limbs movement (manual motion, mouse vs key)
robot3.c - connected limbs movement (data driven motion)
robot3 robot3.dat
pilot.c - game, exercise (motion)
planets.c - education, more on lighting later (motion)
SphereMotion.java - moving 3D lights (motion)
trackball.c - user control of view
skyfly - game, training, demo (motion)
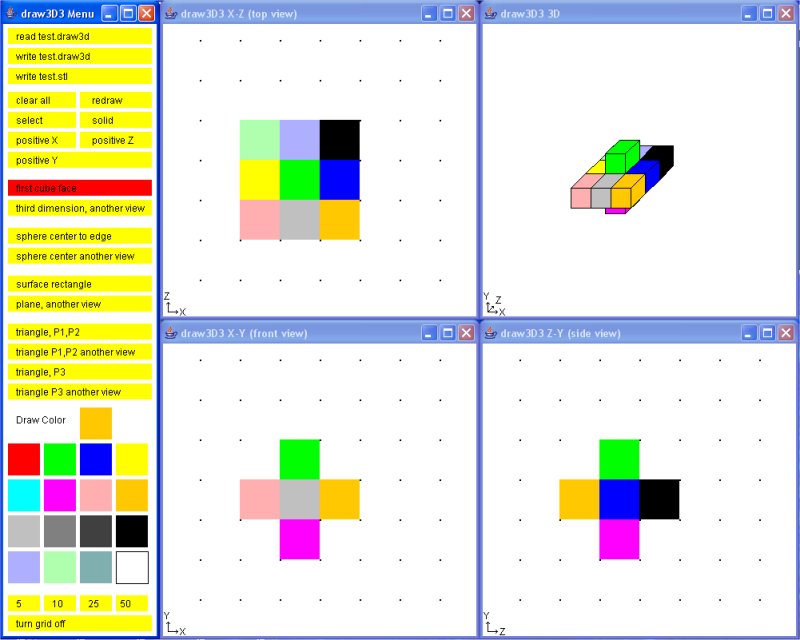
draw3D1.java - evolving 3D data entry (multiple windows)
threads, manual menu
draw3D2.java - evolving
solid and wireframe, flipping, read/write
draw3D3.java - evolving
test.draw3d test data
RunThread.java Four windows, possible multi core
 four_windows.c - display multiple windows in OpenGL four_windows.gif
Techniques for developing interactive graphics applications
robot.c I considered not much to talk about robot.jpg
dynamic.c A follow-on is some way, of robot.c was hard to read. dynamic.jpg
robot2.c was an interesting exercise for me to develop. robot2.jpg
My approach was to copy dynamic.c to robot2.c and make the following
changes, in order, compiling (fixing) and running (fixing) each change.
I could not see the lower leg from the upper leg, thus I changed the
colors for various body parts. Since this was a 'lighting' scene,
it was a matter of changing the emitted light to white and covering
the various limbs with material of various colors.
Now that I could see the motion better, I wanted to make the robot
bend, not just turn. Yuk! The code used numbers, 1, 2, 3 ... rather
than named numbers for the angles. Thus I went through and changed
all references, menu, angle[?] and a few others to names, #define's.
This really helped me understand the code because I had to look
at every section.
With menu and angles and rotations named, it was easy to add two
menu items, one to increase motion per click, another to decrease
motion per click.
Now it was easy to add bend to the torso because I had seen that
the head could both rotate and bend, just cut-and-paste with some
name changing.
When I lifted both legs, the robot did not lower itself, unreal.
Thus I added keyboard function for 'x', 'X', 'y' and 'Y' so the
robot could be moved.
Future ideas are to "fix" the upper limbs, shoulder hip, to both
rotate up and down and sideways like real limbs. Then add "hands"
with some kind of grip. Texture map the face. Change cylinders
to ellipsoids. Be able to read and save a script of a sequence
of motions. Oh! But if I did that, students could not use it
as a project.
P.S. somewhere along the way I added + and - so the "repeat" function
of the keyboard would do what the mouse clicks would do, only faster.
Thus there became a 'move' function, which now should be stripped
of the cases and all of it executed every time.
robot2.c is an example of why there are many lines in an
interactive program. Much code is repeated yet is not suitable
for putting in loops. I expect this program would become more
unreadable and unmaintainable using loops.
A possible project is to implement a "record" mode where a user
moves the robots limbs to make the robot walk, run, dance, jump etc.
Then a "play" mode where the robot performs the recorded motions.
robot3.c Then, finally time to add data driven.
A typical data structure for each move might have:
sequence number
delta time for move
mode (just move, interpolate, repeat sequence)
x coordinate
y coordinate
z coordinate
number of joints to move
joint angle
joint angle
...
or an optional repeat sequence
sequence number
delta time for move
mode repeat sequence
from sequence number
to sequence number
robot3.dat is my first implementation
If the "record" kept an ASCII text file, the user could edit
the action and potentially have a computer program generate
the motions.
User interface buttons similar to those found on VCR or DVD
recorders would seem appropriate.
The robot could be replaced by a more human figure, an animal
or some pseudo figure like a car, truck or machine that could
do non characteristic actions. e.g. cartoon characters.
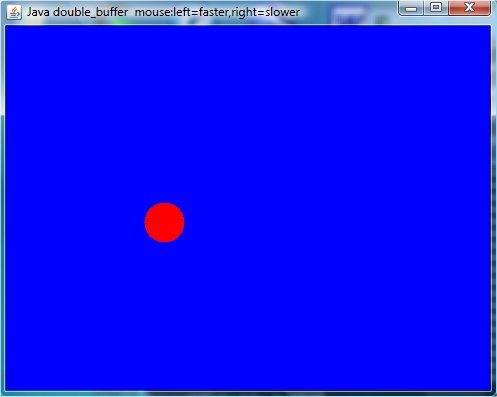
Double buffering in Java takes some effort. The code below
shows a reasonably small example that could be copied if your
project is in Java and has any fast moving objects.
double_buffer.java
Compile and run this program, click left mouse many times to
get a very fast moving red ball.
four_windows.c - display multiple windows in OpenGL four_windows.gif
Techniques for developing interactive graphics applications
robot.c I considered not much to talk about robot.jpg
dynamic.c A follow-on is some way, of robot.c was hard to read. dynamic.jpg
robot2.c was an interesting exercise for me to develop. robot2.jpg
My approach was to copy dynamic.c to robot2.c and make the following
changes, in order, compiling (fixing) and running (fixing) each change.
I could not see the lower leg from the upper leg, thus I changed the
colors for various body parts. Since this was a 'lighting' scene,
it was a matter of changing the emitted light to white and covering
the various limbs with material of various colors.
Now that I could see the motion better, I wanted to make the robot
bend, not just turn. Yuk! The code used numbers, 1, 2, 3 ... rather
than named numbers for the angles. Thus I went through and changed
all references, menu, angle[?] and a few others to names, #define's.
This really helped me understand the code because I had to look
at every section.
With menu and angles and rotations named, it was easy to add two
menu items, one to increase motion per click, another to decrease
motion per click.
Now it was easy to add bend to the torso because I had seen that
the head could both rotate and bend, just cut-and-paste with some
name changing.
When I lifted both legs, the robot did not lower itself, unreal.
Thus I added keyboard function for 'x', 'X', 'y' and 'Y' so the
robot could be moved.
Future ideas are to "fix" the upper limbs, shoulder hip, to both
rotate up and down and sideways like real limbs. Then add "hands"
with some kind of grip. Texture map the face. Change cylinders
to ellipsoids. Be able to read and save a script of a sequence
of motions. Oh! But if I did that, students could not use it
as a project.
P.S. somewhere along the way I added + and - so the "repeat" function
of the keyboard would do what the mouse clicks would do, only faster.
Thus there became a 'move' function, which now should be stripped
of the cases and all of it executed every time.
robot2.c is an example of why there are many lines in an
interactive program. Much code is repeated yet is not suitable
for putting in loops. I expect this program would become more
unreadable and unmaintainable using loops.
A possible project is to implement a "record" mode where a user
moves the robots limbs to make the robot walk, run, dance, jump etc.
Then a "play" mode where the robot performs the recorded motions.
robot3.c Then, finally time to add data driven.
A typical data structure for each move might have:
sequence number
delta time for move
mode (just move, interpolate, repeat sequence)
x coordinate
y coordinate
z coordinate
number of joints to move
joint angle
joint angle
...
or an optional repeat sequence
sequence number
delta time for move
mode repeat sequence
from sequence number
to sequence number
robot3.dat is my first implementation
If the "record" kept an ASCII text file, the user could edit
the action and potentially have a computer program generate
the motions.
User interface buttons similar to those found on VCR or DVD
recorders would seem appropriate.
The robot could be replaced by a more human figure, an animal
or some pseudo figure like a car, truck or machine that could
do non characteristic actions. e.g. cartoon characters.
Double buffering in Java takes some effort. The code below
shows a reasonably small example that could be copied if your
project is in Java and has any fast moving objects.
double_buffer.java
Compile and run this program, click left mouse many times to
get a very fast moving red ball.
 An application of the above double_buffer.java is Springdb.java
Compare to basic Spring.java
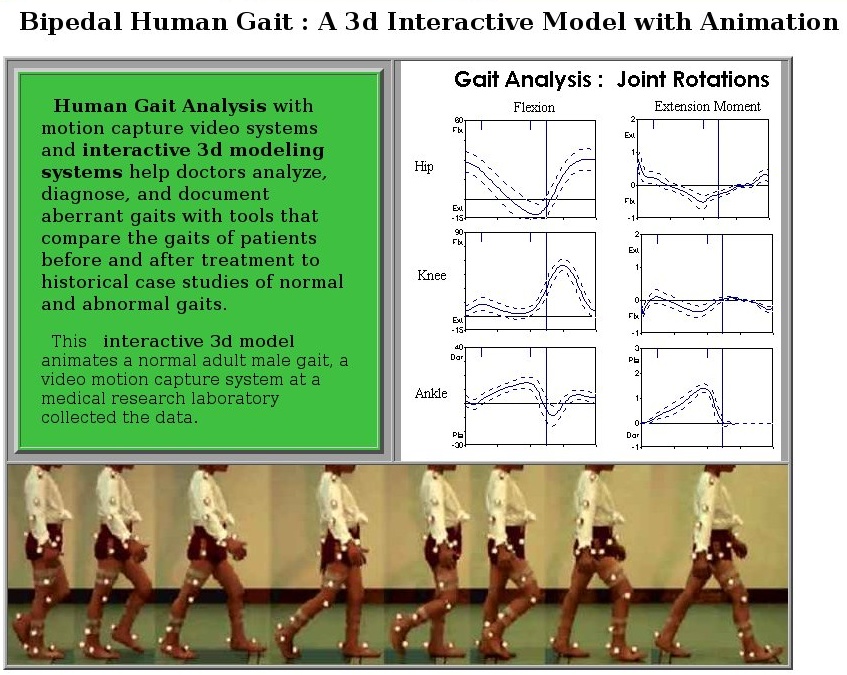
Professional movie makers use sophisticated software that has
many motions preprogrammed. A technique for getting realistic
motion is to dress a person in clothing that has colored dots
placed at "control points" on the body. The person is then
recorded doing the desired actions. The coordinates of the dots
are extracted at each time step. The coordinates are then
entered into a data file for future use in animating figures.
The result is movies such as "Toy Story" , "Madagascar" ,
"Over the Hedge" , "Tale of Despereaux" , "Bolt" , etc.
to name just a few.
An application of the above double_buffer.java is Springdb.java
Compare to basic Spring.java
Professional movie makers use sophisticated software that has
many motions preprogrammed. A technique for getting realistic
motion is to dress a person in clothing that has colored dots
placed at "control points" on the body. The person is then
recorded doing the desired actions. The coordinates of the dots
are extracted at each time step. The coordinates are then
entered into a data file for future use in animating figures.
The result is movies such as "Toy Story" , "Madagascar" ,
"Over the Hedge" , "Tale of Despereaux" , "Bolt" , etc.
to name just a few.
Many "trailers" are on line for viewing.
www.apple.com/trailers/disney/the_incredibles/trailer2_large.html
www.apple.com/trailers/disney
www.apple.com/trailers/dreamworks
The "Menu Bar" and drop down menus are the most common today.
You could do your own menus, yet you will probably want to use
the large amount of code provided by a GUI tool kit.
This lecture will cover the details often hidden by most GUI tool
kits. You may need to understand how menus are created in case
you have to work around a bug or problem in the tool kit you are using.
The richest toolkit for menus is Motif. (Linux/Unix/macOS)
Close behind is proprietary Microsoft Windows C++ classes.
Next comes Java Swing/Swing2.
The weakest we will look at is OpenGL with GLUT. Yet, strong by getting FLTK,
the Fast Light ToolKit from www.fltk.org
Defacto standardization makes some design issues obvious.
The "File" is on the left of the "Menu Bar".
The "Help" is on the right, or rightmost, of the "Menu Bar".
Using defacto standard names helps average users.
Using names that mean something to you are best for an application
you write for your own use.
Example programs to be covered are:
In X Windows using Motif, observe windows, widgets and buttons
being created, callbacks assigned and functions to handle callbacks.
The executable is w4 .
w4a.c
 In OpenGL, a mouse click is used to popdown the menu.
Note that OpenGL requires sub menus to be created before
the main menu, the opposite order of Motif or Java.
w4gl.c
Not able to capture open menu and get graphic.
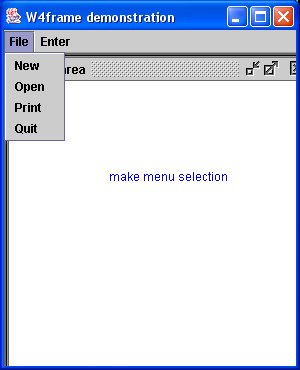
In Java using Swing, observe menu creation then menu item creation,
action listeners and functions to handle actions.
W4frame.java
In OpenGL, a mouse click is used to popdown the menu.
Note that OpenGL requires sub menus to be created before
the main menu, the opposite order of Motif or Java.
w4gl.c
Not able to capture open menu and get graphic.
In Java using Swing, observe menu creation then menu item creation,
action listeners and functions to handle actions.
W4frame.java
 For the more complex example, Spline Tutorial, download and
compile: (note package myjava; and import myjava.*; fix to suit)
I have this in my 'myjava' directory and use java myjava.SplineFrame
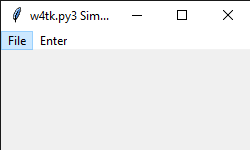
In Python using tk, simple menu and callbacks.
w4tk.py3
For the more complex example, Spline Tutorial, download and
compile: (note package myjava; and import myjava.*; fix to suit)
I have this in my 'myjava' directory and use java myjava.SplineFrame
In Python using tk, simple menu and callbacks.
w4tk.py3
 Note that other windows are opened for tutorial information.
The 'parameter' pull down menu uses radio buttons.
The mouse is used for both menu selection and graphics.
In Python using tk, a rotating dot, must be run to observe
This is an example of moving an object.
w5tk.py3 source code
Spline example in Java, reading files and math
Spline.java
SplineFrame.java
Then you need the *.txt files that are read at execution time:
SplineHelp.txt
SplineAbout.txt
SplineAlgorithm.txt
SplineEvaluate.txt
SplineIntegrate.txt
Note that other windows are opened for tutorial information.
The 'parameter' pull down menu uses radio buttons.
The mouse is used for both menu selection and graphics.
In Python using tk, a rotating dot, must be run to observe
This is an example of moving an object.
w5tk.py3 source code
Spline example in Java, reading files and math
Spline.java
SplineFrame.java
Then you need the *.txt files that are read at execution time:
SplineHelp.txt
SplineAbout.txt
SplineAlgorithm.txt
SplineEvaluate.txt
SplineIntegrate.txt
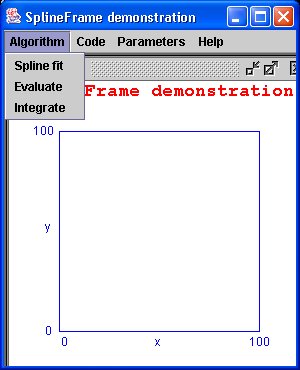 Clicking on menu bar 'Algorithm' (no 'File' items needed)
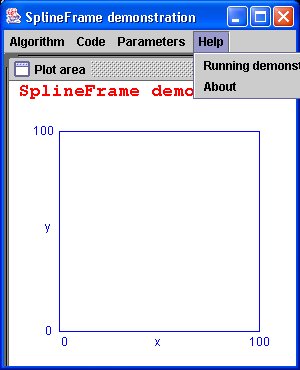 Clicking on menu bar 'Help' (Note that pull down menu can go outside
the main window in Java.)
To run demo I have my flash drive in the USB port and do commands:
F:
setup # runs setup.bat to set path and classpath
cd myjava # where this demo is located
java myjava.SplineFrame # I used 'package'
The Lecture outline was:
Show demo's.
Quickly survey code.
Explain how menubar or other features are created.
Explain how menus are created in menubars.
Explain how menu items are created in menus.
Explain how callbacks are coded to act when a menu item is selected.
Show where to put code that responds to a menu item select.
Can be in-line code if short and simple.
Use function call to handle long or complex actions.
Very repetitive, much to remember, copy, cut and paste to suit.
HW2 is assigned
Clicking on menu bar 'Help' (Note that pull down menu can go outside
the main window in Java.)
To run demo I have my flash drive in the USB port and do commands:
F:
setup # runs setup.bat to set path and classpath
cd myjava # where this demo is located
java myjava.SplineFrame # I used 'package'
The Lecture outline was:
Show demo's.
Quickly survey code.
Explain how menubar or other features are created.
Explain how menus are created in menubars.
Explain how menu items are created in menus.
Explain how callbacks are coded to act when a menu item is selected.
Show where to put code that responds to a menu item select.
Can be in-line code if short and simple.
Use function call to handle long or complex actions.
Very repetitive, much to remember, copy, cut and paste to suit.
HW2 is assigned
In GUI applications, the code to get user input is much more
complex than the code for a command line program.
Much user input is via the mouse, button press or motion.
Some user input is from the keyboard.
You have the power to really mess up the user.
Make the user click the mouse then type on the keyboard then
click the mouse then type on the keyboard then click the
mouse then type on the keyboard, etc. etc. etc.
A user friendly interface has menus, buttons, graphics, etc
to allow the user many steps with the mouse before touching
the keyboard. Then when the keyboard is needed, allow the user
to perform many steps before having to go back to the mouse.
Mouse button press input in examples:
w2.c X Windows
w2gl.c OpenGL
W2frame.java Java
(run and click 4 corners, see coordinates)
w2tkm.py Python Tk just mouse
w2tk.py Python Tk
canvas_mouse.txt view html5
canvas_mouse.html html5
(move mouse, see coordinates)
Getting input data, text, into a graphical user interface program
is much more difficult. The input of numbers is accomplished by
inputting a character string and converting the character string
to a number inside the program.
The X Windows Motif program w5a has one pull-down menu on the menu bar,
"Set Values". On the pull-down there are five menu items:
"Number"
"View Angle"
"Name"
"Apply"
"Quit"
The selecting one of the first three causes a popup dialog box to
appear. The dialog box is where the user enters the data.
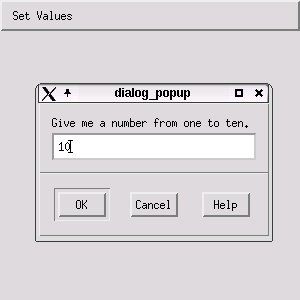
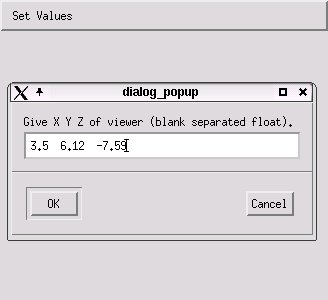
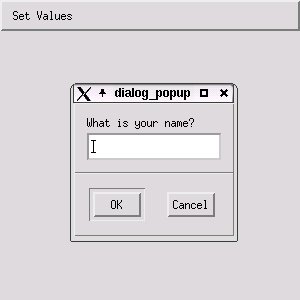 The source code is:
w5a.c X Windows
w5.h
In OpenGL and GLUT I wrote my own data entry in fixed windows.
These could be made into separate windows and could be
selected by a menu.
test_text_in.c OpenGL
demo_text_in.c
text_in.h
text_in.c
Now, add a popup dialog window for user data entry.
w5gl.c
The Java implementation is the shortest.
Similar "toolkit" classes should be available for
Microsoft C++ and C#.
W5frame.java Java
The source code is:
w5a.c X Windows
w5.h
In OpenGL and GLUT I wrote my own data entry in fixed windows.
These could be made into separate windows and could be
selected by a menu.
test_text_in.c OpenGL
demo_text_in.c
text_in.h
text_in.c
Now, add a popup dialog window for user data entry.
w5gl.c
The Java implementation is the shortest.
Similar "toolkit" classes should be available for
Microsoft C++ and C#.
W5frame.java Java
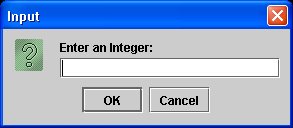
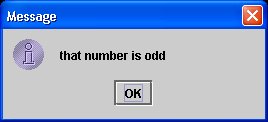
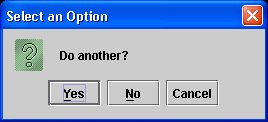 Another simple screen input/output Java program is Fahrenheit.java
For games or interactive keyboard use, you will need a key listener.
The events are key pressed, key typed, and key released.
You probably only want key released and a switch on "keyCode"
TestKeyCode.java
with output for key sequence a A 0 space right left up down ctrl enter
TestKeyCode.out
In Python, to get keysyms, catch an event:
test_keysym.py
test_keysym_py.out
When you can input text, a character string, then you can
use your programming language to open and read and write files.
You can get numeric data when needed but do not use this as
a substitute for mouse input for numeric data,
with possible use a grid for accuracy.
For picture or numeric data, to see plot, scale:
grid.py3 source code
grid.py3 source code
Another simple screen input/output Java program is Fahrenheit.java
For games or interactive keyboard use, you will need a key listener.
The events are key pressed, key typed, and key released.
You probably only want key released and a switch on "keyCode"
TestKeyCode.java
with output for key sequence a A 0 space right left up down ctrl enter
TestKeyCode.out
In Python, to get keysyms, catch an event:
test_keysym.py
test_keysym_py.out
When you can input text, a character string, then you can
use your programming language to open and read and write files.
You can get numeric data when needed but do not use this as
a substitute for mouse input for numeric data,
with possible use a grid for accuracy.
For picture or numeric data, to see plot, scale:
grid.py3 source code
grid.py3 source code
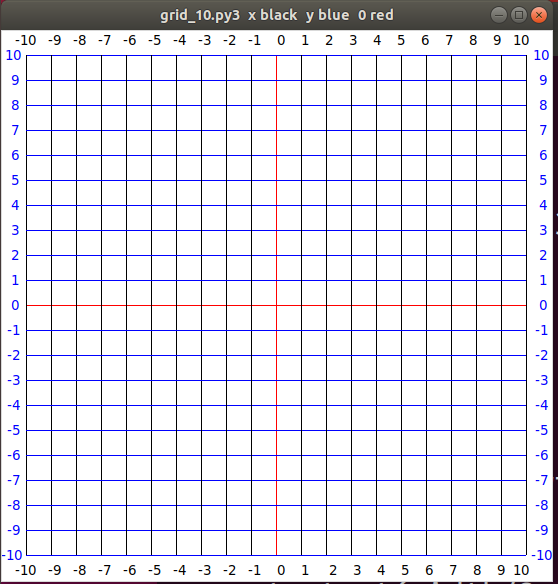 A sample Java Swing File-Open then select a file is:
W4frame.java that uses
ExampleFileFilter.java
A crude sample of reading a directory in C is dirprt.c
This could be used in an OpenGL application with a display of the
file names, selectable by using the mouse. Basically, a do-it-yourself
file open dialog box.
The File-open is handled by a widget in Motif as shown in
the callback function DoOpen XmOpen.c
A sample Java Swing File-Open then select a file is:
W4frame.java that uses
ExampleFileFilter.java
A crude sample of reading a directory in C is dirprt.c
This could be used in an OpenGL application with a display of the
file names, selectable by using the mouse. Basically, a do-it-yourself
file open dialog box.
The File-open is handled by a widget in Motif as shown in
the callback function DoOpen XmOpen.c
Text size is measured in "points".
One "point" is 1/72 of an inch.
Thus text drawn at 72pt would be about one inch high.
(On paper!, it may be almost any size on a computer screen.)
On a computer screen, a 5 by 7 size means each letter of text
fits in a box: 5 pixels wide by 7 pixels high.
Text such as lower case letters 'p' and 'q' extend below
the baseline for placing text. Upper case letters and language
marks may extend above the normal character height.
A letter or symbol in a font is called a glyph.
The bad news about fonts is that they require a lot of work
to create and thus are almost always copyrighted.
The good news is that your computer probably has many fonts available
for your program to use.
Fonts may have casual names such as Times Roman 12pt or
Courier 10pt. The "official" computer name is presented later.
Fonts may have proportional spacing, e.g. Times Roman,
where 'm' takes more space than 'i', and additionally
may be rendered using kerning that may place "AT" closer
together than 'A' 'T'.
Fonts may have fixed spacing, e.g. Courier, where every letter,
glyph, takes the same width.
Most people prefer proportional kerned spacing when reading
a newspaper or book, yet looking at computer source code
most prefer fixed width spacing.
TestFonts.java shows Courier and Times New Roman
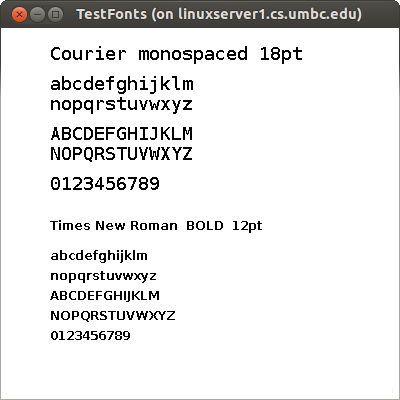 and writes out the available fonts TestFonts.outs
test_shape.py shows a few Python fonts
and writes out the available fonts TestFonts.outs
test_shape.py shows a few Python fonts
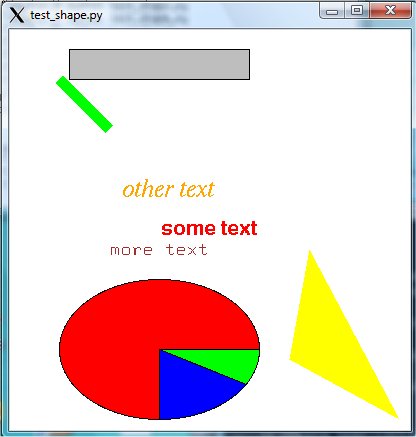 If your application needs the user to select a font, a style and a size,
then a Font Selection Box may be the most user friendly. Below is the
Word Perfect and Microsoft Word font selection windows.
If your application needs the user to select a font, a style and a size,
then a Font Selection Box may be the most user friendly. Below is the
Word Perfect and Microsoft Word font selection windows.
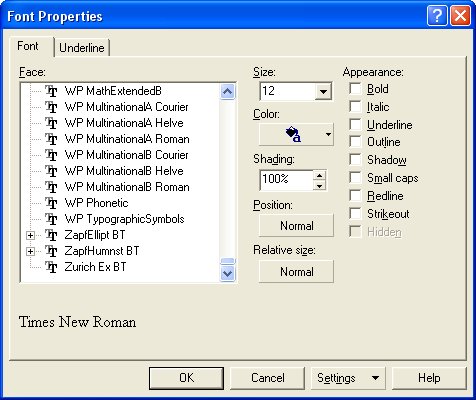
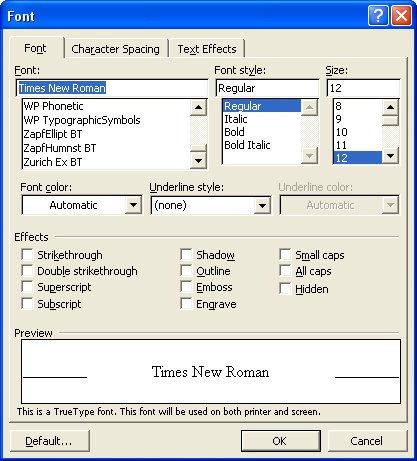 Using X Windows you can experiment with creating or modifying
a font using the X Font Editor, xfed.c
on font timr24.bdf or font courr24.bdf
"bdf" indicates Berkeley Distribution Font IIRC.
Note the line starting "FONT" that has the official name of the font.
Fonts are registered so that every font has a unique official
designation.
To find the fonts available on your X Windows system:
In X Windows use font_list.c and
font_show.c
Note the font designation format in these two programs.
font_list.out shows over 500 fonts
on one system where font_list.c was run.
On Microsoft Windows, the most common font format is True Type Font.
In C:\ the command dir /s *.ttf will show the available fonts.
An example of one PC shows over 1300 font files, yet there is a
lot of duplication in the 92MB of disk space used. pc_ttf.fonts
There are a number of programs for converting from one font format
to another font format. ttf2pt1 is one example.
Windows-based applications can use three different kinds of font technologies
to display and print text: raster, vector, and TrueType.
------ ------ --------
The differences between these fonts reflect the way that the glyph for
each character or symbol is stored in the respective font file.
In raster fonts, a glyph is a bitmap that application programs
use to draw a single character or symbol in the font.
In vector fonts, a glyph is a collection of line endpoints that define
the line segments that application programs use to draw a character
or symbol in the font.
In TrueType fonts, a glyph is a collection of line and curve commands
as well as a collection of hints. The line and curve commands are used
to define the outline of the bitmap for a character or symbol in the
TrueType font. The hints are used to adjust the length of the lines and
shapes of the curves used to draw the character or symbol. These hints and
the respective adjustments are based on the amount of scaling used to reduce
or increase the size of the glyph.
Because the bitmaps for each glyph in a raster font are designed for a specific
resolution of device, raster fonts are generally considered to be device
dependent. Vector fonts, on the other hand, are not device dependent, because
each glyph is stored as a collection of scalable lines. However, vector fonts
are generally drawn more slowly than raster or TrueType fonts. TrueType fonts
provide both relatively fast drawing speed and true device independence. By
using the hints associated with a glyph, a developer can scale the characters
from a TrueType font up or down and still maintain their original shape. As
previously mentioned, the glyphs for a font are stored in a font file.
For raster and vector fonts, the font data is divided into two
parts: a header describing the font's metrics and the glyph data. A
font file for a raster or vector font is identified by the .FON
filename extension. For TrueType fonts, there are two files for each font.
The first file contains a relatively short header and the second contains
the actual font data. The first file is identified by a .FOT extension
and the second is identified by a .TTF extension.
The OpenType font format is an extension of the TrueType font format,
adding support for PostScript font data. The OpenType font format was
developed jointly by Microsoft and Adobe. OpenType fonts and the operating
system services which support OpenType fonts provide users with a simple
way to install and use fonts, whether the fonts contain TrueType outlines
or CFF (PostScript) outlines.
The OpenType font format addresses the following goals:
broader multi-platform support
better support for international character sets
better protection for font data
smaller file sizes to make font distribution more efficient
broader support for advanced typographic control
OpenType fonts are also referred to as TrueType Open v.2.0 fonts, because they
use the TrueType 'sfnt' font file format. PostScript data included in OpenType
fonts may be directly rasterized or converted to the TrueType outline format
for rendering, depending on which rasterizers have been installed in the host
operating system. But the user model is the same: OpenType fonts just work.
Users will not need to be aware of the type of outline data in OpenType fonts.
And font creators can use whichever outline format they feel provides the best
set of features for their work, without worrying about limiting a font's
usability
OpenType fonts can include the OpenType Layout tables, which allow font
creators to design better international and high-end typographic fonts.
The OpenType Layout tables contain information on glyph substitution, glyph
positioning, justification, and baseline positioning, enabling text processing
applications to improve text layout.
As with TrueType fonts, OpenType fonts allow the handling of large glyph sets
using Unicode encoding. Such encoding allows broad international support,
as well as support for typographic glyph variants.
What can happen if your GUI program is executed on a system different
from the development system? Assuming the program runs and uses some
neat fonts, what can happen? Well two common approaches are to just
show a blob if a font is not available on the users system or choose
a default font to try to give the user a workable system. Note that
fonts are typically installed on a specific computer. Not all users
have large numbers of fonts. Some GUI applications carry along
their own set of fonts, as was shown pc_ttf.fonts
in various directories.
Using X Windows you can experiment with creating or modifying
a font using the X Font Editor, xfed.c
on font timr24.bdf or font courr24.bdf
"bdf" indicates Berkeley Distribution Font IIRC.
Note the line starting "FONT" that has the official name of the font.
Fonts are registered so that every font has a unique official
designation.
To find the fonts available on your X Windows system:
In X Windows use font_list.c and
font_show.c
Note the font designation format in these two programs.
font_list.out shows over 500 fonts
on one system where font_list.c was run.
On Microsoft Windows, the most common font format is True Type Font.
In C:\ the command dir /s *.ttf will show the available fonts.
An example of one PC shows over 1300 font files, yet there is a
lot of duplication in the 92MB of disk space used. pc_ttf.fonts
There are a number of programs for converting from one font format
to another font format. ttf2pt1 is one example.
Windows-based applications can use three different kinds of font technologies
to display and print text: raster, vector, and TrueType.
------ ------ --------
The differences between these fonts reflect the way that the glyph for
each character or symbol is stored in the respective font file.
In raster fonts, a glyph is a bitmap that application programs
use to draw a single character or symbol in the font.
In vector fonts, a glyph is a collection of line endpoints that define
the line segments that application programs use to draw a character
or symbol in the font.
In TrueType fonts, a glyph is a collection of line and curve commands
as well as a collection of hints. The line and curve commands are used
to define the outline of the bitmap for a character or symbol in the
TrueType font. The hints are used to adjust the length of the lines and
shapes of the curves used to draw the character or symbol. These hints and
the respective adjustments are based on the amount of scaling used to reduce
or increase the size of the glyph.
Because the bitmaps for each glyph in a raster font are designed for a specific
resolution of device, raster fonts are generally considered to be device
dependent. Vector fonts, on the other hand, are not device dependent, because
each glyph is stored as a collection of scalable lines. However, vector fonts
are generally drawn more slowly than raster or TrueType fonts. TrueType fonts
provide both relatively fast drawing speed and true device independence. By
using the hints associated with a glyph, a developer can scale the characters
from a TrueType font up or down and still maintain their original shape. As
previously mentioned, the glyphs for a font are stored in a font file.
For raster and vector fonts, the font data is divided into two
parts: a header describing the font's metrics and the glyph data. A
font file for a raster or vector font is identified by the .FON
filename extension. For TrueType fonts, there are two files for each font.
The first file contains a relatively short header and the second contains
the actual font data. The first file is identified by a .FOT extension
and the second is identified by a .TTF extension.
The OpenType font format is an extension of the TrueType font format,
adding support for PostScript font data. The OpenType font format was
developed jointly by Microsoft and Adobe. OpenType fonts and the operating
system services which support OpenType fonts provide users with a simple
way to install and use fonts, whether the fonts contain TrueType outlines
or CFF (PostScript) outlines.
The OpenType font format addresses the following goals:
broader multi-platform support
better support for international character sets
better protection for font data
smaller file sizes to make font distribution more efficient
broader support for advanced typographic control
OpenType fonts are also referred to as TrueType Open v.2.0 fonts, because they
use the TrueType 'sfnt' font file format. PostScript data included in OpenType
fonts may be directly rasterized or converted to the TrueType outline format
for rendering, depending on which rasterizers have been installed in the host
operating system. But the user model is the same: OpenType fonts just work.
Users will not need to be aware of the type of outline data in OpenType fonts.
And font creators can use whichever outline format they feel provides the best
set of features for their work, without worrying about limiting a font's
usability
OpenType fonts can include the OpenType Layout tables, which allow font
creators to design better international and high-end typographic fonts.
The OpenType Layout tables contain information on glyph substitution, glyph
positioning, justification, and baseline positioning, enabling text processing
applications to improve text layout.
As with TrueType fonts, OpenType fonts allow the handling of large glyph sets
using Unicode encoding. Such encoding allows broad international support,
as well as support for typographic glyph variants.
What can happen if your GUI program is executed on a system different
from the development system? Assuming the program runs and uses some
neat fonts, what can happen? Well two common approaches are to just
show a blob if a font is not available on the users system or choose
a default font to try to give the user a workable system. Note that
fonts are typically installed on a specific computer. Not all users
have large numbers of fonts. Some GUI applications carry along
their own set of fonts, as was shown pc_ttf.fonts
in various directories.
International, language independent
If there is any chance your code might be used in a non English
speaking country, do the following:
Do not have any text in any graphic. Not in .jpg, .png, .tif, .gif, etc.
For every string of text that might be displayed, put the text string
in a file or files. Reference the file and string to draw the text.
You might even include the font, font size, bold, etc. in the file.
Then an international version of your program would just deliver
a different file or files with that native language. Your code would
not have to be changed.
Also, think about avoiding local, to your country, colloquial
symbols or symbols that may be objectionable to other countries.
Generally avoid politics and religion if there is any
chance of internationalization.
Below is only for struggling Java users:
Some example g.drawString examples using various fonts
in public void paint(Graphics g)
font cur16 = new Font("courier", Font.BOLD, 16);
g.setFont(cur16);
g.setColor(Color.green);
g.drawString("courier 16 in green", 100, 50); // at x=100, y=50
More examples and one example of 256 glyphs, and unicode glyph
TestFonts2.java
TestFonts2.out list of font names, families
 For Unicode glyphs see http://www.unicode.org/charts/charindex.html
Below is only for struggling OpenGL users:
In OpenGL using GLUT the following bitmap fonts are available:
GLUT_BITMAP_HELVETICA_10
GLUT_BITMAP_HELVETICA_12
GLUT_BITMAP_HELVETICA_18
GLUT_BITMAP_TIMES_ROMAN_10
GLUT_BITMAP_TIMES_ROMAN_24
GLUT_BITMAP_9_BY_15
GLUT_BITMAP_8_BY_13
Bitmap fonts do not move with the scene and do not scale
when the window size changes.
These are rendered using code such as 'show_text' from
text_in.c
void show_text(GLfloat x, GLfloat y, char msg[])
{
int len, i;
glPushMatrix();
glRasterPos2f(x, y);
len = strlen(msg);
for (i = 0; i<len; i++)
glutBitmapCharacter(GLUT_BITMAP_HELVETICA_12, msg[i]);
glPopMatrix();
} /* end show_text */
Then in 'display' set the color or material and render the text:
glLoadIdentity();
glColor3f(0.0, 0.0, 0.0); /* black */
show_text(-0.5, -1.0, "user input, file name");
If you do not see your text:
If using lighting, be sure material is applied to the text.
If using lighting, be sure the 'Z' coordinate is correct to
receive the light on the front of the text.
In various perspective views, it may be hard to figure out
where to place the text. One extreme measure is to use
the second projection as in:
static void drawText(int x, int y, char * msg)
{
int i, len;
glMatrixMode(GL_PROJECTION);
glPushMatrix();
glLoadIdentity();
glOrtho(0, winWidth, 0, winHeight, -1, 1);
glMatrixMode(GL_MODELVIEW);
glPushMatrix();
glLoadIdentity();
glColor3f(1.0f, 1.0f, 0.0f);
glRasterPos2i(x, y);
len = strlen(msg);
for (i=0; i<len; i++)
glutBitmapCharacter(GLUT_BITMAP_HELVETICA_12, msg[i]);
glPopMatrix();
glPopMatrix();
}
In OpenGL there are stroke fonts that move with objects and
scale when the window size changes. These fonts include:
GLUT_STROKE_ROMAN
GLUT_STROKE_MONO_ROMAN
static void drawText(GLfloat x, GLfloat y, char text[])
{
char *p;
glPushMatrix();
glLoadIdentity();
glTranslatef(x, y, 0.0);
glScalef(0.01, 0.01, 0.0); /* 0.1 to 0.001 as required */
for(p=text; *p; p++)
glutStrokeCharacter(GLUT_STROKE_ROMAN, *p);
glPopMatrix();
}
Then in 'display' call the 'drawText' function using:
glLoadIdentity ();
glEnable(GL_LINE_SMOOTH);
glBlendFunc(GL_SRC_ALPHA, GL_ONE_MINUS_SRC_ALPHA);
glEnable(GL_BLEND);
glLineWidth(1.0);
/* glColor3f or material set here */
drawText(3.0, 3.0, "Roman_stroke");
glLineWidth(2.0);
drawText(2.0, 6.0, "width 2 Roman_stroke");
Have you ever been editing for a long time, then suddenly, crash?
Were you able to recover most if not all of your work?
A user may spend many hours on a GUI program and expects reasonable
protection.
As appropriate, some applications save automatically:
at some time interval, after some amount of input or at some key
place in program execution.
Other applications save only when the user specifically chooses
to save. Think about what is appropriate for your application.
The technical process of saving user data can depend on programming
language and operating system. A few applications have a lot of
data and complex structure in the data and thus use a full
relational database. Most application use a simple file for saving
and restoring user data.
Even though operating system crashes are much less common, there
are still occasional power outages, network outages, network
disconnects or your pet terminating you application.
(One of my cats likes to jump six feet onto my keyboard while
I am typing. This causes random chaos until the cat is
safely on my lap.)
Thus, the programmer must consider all places the application may
be abruptly terminated and protect the users data from loss.
The "bad method":
Read in the users previous work, save the users present work by
writing the new data into the old file. Consider what remains if
the application is abruptly terminated just as the first record
is being written: The old data is lost, the new data is not saved,
the user has lost everything.
A "better method":
Read in the users previous work from a permanent file, close the file.
When a save is to be executed, create a new file with a
backup temporary name, write the users new work to the new file.
Flush and close the new file. Open the permanent users file for
writing, open the backup temporary file read-only, copy the
backup temporary file to the permanent file, flush and close.
Then, delete the backup temporary file. This method at worse has
preserved the users original work. Upon startup the application
should look for the backup temporary file name first, (it will
always be the latest user work) and if not found, look for the
users permanent file, and if not found create an initialized
user permanent file.
Other versions of A "better method":
If provided by your programming language and operating system,
once the backup temporary file is closed, rename or "move" the
backup temporary name to the permanent file name. Both files should
be in the same directory and thus only a directory update is
performed. At least one of the files should be available even when
there is an abrupt termination during the rename.
For a game, please provide a "pause." It may be a phone
interruption or a biologically urgent need. Then, there
needs to be a "resume." Since the game does not know how
long the pause will be, the state information should be
written to a file. The computer could shut itself off or
some other activity may kill the game. The "resume" may
test if the state is still in RAM and quickly continue,
or determine the state must be restored from a file.
What file format should be used for saving?
That depends on the application. My first choice is always an
plain text ASCII file that I can look at (and fix if necessary)
with any text editor (or word processor).
For a large amount of numeric data, that is saved and restored often,
an unformatted binary file may be more appropriate. It turns out
that formatting binary data to ASCII numbers and formatting back is
a very CPU intensive process. The ASCII form usually makes the
file larger and thus also increases the disk read and write time.
The amount and type of data varies according to the application.
For a game or puzzle or lesson you would keep some statistics and
possible user identification. For example, arcade game style is
to have the highest scores displayed with the players initials.
At the end of each game the permanent file is read and the new
score inserted, in order, if it is higher than the lowest score.
Usually the maximum number of saved scores is limited.
For a one user game, the save file and present status, might be
presented similar to FreeCell statistics:
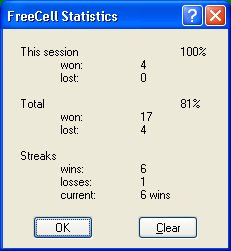 For an object oriented graphics editor the save file might look like
rectangle 10.3 12.5 4.0 3.0 filled 255 0 0 0 255 0
circle 5.7 19.2 5.0 outline 128 128 128
line 22.7 39.4 22.7 59.4 3 0 0 255
text 14.6 50.2 courier 14 "this is my text" 0 0 0
It is the application programmers choice to use fixed fields
or just a sequence with the interpretation based on the first field.
Above, the rectangle has a lower left x,y at 10.3 12.5,
a width and height of 4.0 and 3.0, it is filled with red and
outlined in green.
The circle has center at x,y 5.7 19.2, radius 5.0 and is
just outlined in medium gray color.
The line goes from x1,y1 to x2,y2 with line width 3 and color blue.
The text has a lower left at x,y 14.6 50.2, using courier font 14
point and black.
The words might be replaced with code numbers for more convenient
programming but less convenient editing to fix problems (user
or program). Beware, only add larger code numbers when modifying
your application. Otherwise, getting an old saved file can be
a real surprise. The voice of experience.
In many programming languages it is more convenient to use space
as a separator than to use comma. Fixed fields or just sequential
may depend on a particular programming language.
For an application where the user was creating 3D objects, like
teapots or skulls, the .dat file is convenient.
This file starts with two numbers, the number of points and the number
of polygons. Then the x,y,z of the points followed by the polygons.
Each polygon has a count of the number of points followed by that
number of indices of points, the first point being point 1.
The "C" files include:
datread.h for Utah Graphics .dat .det
datread.c provide reading and writing this file type.
test_datread.c test and demo program
test_datread_c.out test and demo program
cube.dat
drop.dat
Also, see cube.dat below.
The Java files include:
datread.java for Utah Graphics .dat files
test_datread.java test and demo program
test_datread_java.out
For a graphics scene editor that places objects, the users work might be
saved as a file such as:
device: lab6_input1.rle
postscript: lab6_input1.ps
jpeg: input1.jpg
debug: 5
viewport: 400 400
coi: 0 0 0
hither_yon: 1 100
observer: 4 1 20
angle: 8.0
light_position: 10 30 30
light_color: 1 1 1
object: drop.dat
color_type: 1 1 0 0
illumination_parameters: .2 .8 1.0 50
shading: phong
rotate: 45 30 60
scale: 1 1 1
translate: .25 -.36 0
object: drop.dat
color_type: 1 1 1 0
illumination_parameters: .25 .75 1.0 10
shading: phong
rotate: 0 0 180
scale: 1 1 1
translate: 0 .6 0
object: cube.dat
illumination_parameters: .3 .70 0.0 10
shading: phong
color_type: 1 1 .5 .5
scale: 2 2 .1
translate: 0 0 -.5
object: cube.dat
shading: phong
color_type: 1 .2 .9 1
illumination_parameters: .25 .75 1.0 100
scale: 2.0 .2 2.0
translate: 0 -1.0 .5
end
Note that the type of input ends with a colon.
An object in .dat format is placed in the scene with rotations,
scaling and translations that are simple matrices as
covered in an earlier lecture. Shading may be faceted,
phong or none. Color is ARGB and illumination parameters
are ambient, diffuse, specular and shiny. See teapots.c for
examples. The above scene when rendered appears as:
For an object oriented graphics editor the save file might look like
rectangle 10.3 12.5 4.0 3.0 filled 255 0 0 0 255 0
circle 5.7 19.2 5.0 outline 128 128 128
line 22.7 39.4 22.7 59.4 3 0 0 255
text 14.6 50.2 courier 14 "this is my text" 0 0 0
It is the application programmers choice to use fixed fields
or just a sequence with the interpretation based on the first field.
Above, the rectangle has a lower left x,y at 10.3 12.5,
a width and height of 4.0 and 3.0, it is filled with red and
outlined in green.
The circle has center at x,y 5.7 19.2, radius 5.0 and is
just outlined in medium gray color.
The line goes from x1,y1 to x2,y2 with line width 3 and color blue.
The text has a lower left at x,y 14.6 50.2, using courier font 14
point and black.
The words might be replaced with code numbers for more convenient
programming but less convenient editing to fix problems (user
or program). Beware, only add larger code numbers when modifying
your application. Otherwise, getting an old saved file can be
a real surprise. The voice of experience.
In many programming languages it is more convenient to use space
as a separator than to use comma. Fixed fields or just sequential
may depend on a particular programming language.
For an application where the user was creating 3D objects, like
teapots or skulls, the .dat file is convenient.
This file starts with two numbers, the number of points and the number
of polygons. Then the x,y,z of the points followed by the polygons.
Each polygon has a count of the number of points followed by that
number of indices of points, the first point being point 1.
The "C" files include:
datread.h for Utah Graphics .dat .det
datread.c provide reading and writing this file type.
test_datread.c test and demo program
test_datread_c.out test and demo program
cube.dat
drop.dat
Also, see cube.dat below.
The Java files include:
datread.java for Utah Graphics .dat files
test_datread.java test and demo program
test_datread_java.out
For a graphics scene editor that places objects, the users work might be
saved as a file such as:
device: lab6_input1.rle
postscript: lab6_input1.ps
jpeg: input1.jpg
debug: 5
viewport: 400 400
coi: 0 0 0
hither_yon: 1 100
observer: 4 1 20
angle: 8.0
light_position: 10 30 30
light_color: 1 1 1
object: drop.dat
color_type: 1 1 0 0
illumination_parameters: .2 .8 1.0 50
shading: phong
rotate: 45 30 60
scale: 1 1 1
translate: .25 -.36 0
object: drop.dat
color_type: 1 1 1 0
illumination_parameters: .25 .75 1.0 10
shading: phong
rotate: 0 0 180
scale: 1 1 1
translate: 0 .6 0
object: cube.dat
illumination_parameters: .3 .70 0.0 10
shading: phong
color_type: 1 1 .5 .5
scale: 2 2 .1
translate: 0 0 -.5
object: cube.dat
shading: phong
color_type: 1 .2 .9 1
illumination_parameters: .25 .75 1.0 100
scale: 2.0 .2 2.0
translate: 0 -1.0 .5
end
Note that the type of input ends with a colon.
An object in .dat format is placed in the scene with rotations,
scaling and translations that are simple matrices as
covered in an earlier lecture. Shading may be faceted,
phong or none. Color is ARGB and illumination parameters
are ambient, diffuse, specular and shiny. See teapots.c for
examples. The above scene when rendered appears as:
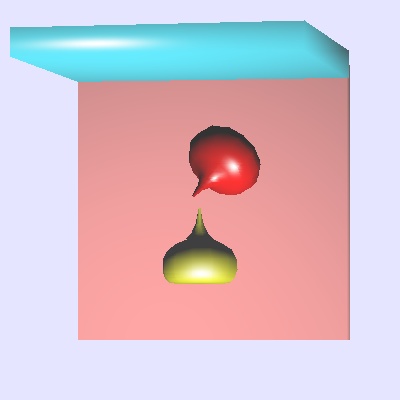 The shapes of objects are stored in .dat files for this "run6"
renderer. The cube.dat is
8 6
-0.5 0.5 0.5
0.5 0.5 0.5
0.5 -0.5 0.5
-0.5 -0.5 0.5
-0.5 0.5 -0.5
0.5 0.5 -0.5
0.5 -0.5 -0.5
-0.5 -0.5 -0.5
4 1 2 3 4
4 5 6 2 1
4 8 7 6 5
4 4 3 7 8
4 2 6 7 3
4 5 1 4 8
0.0 0.0 0.0 0.0 0.0 1.0 0.0 1.0 0.0 4.0 6.0 9.0 1.0 -1.0 -1.0 1.0 -1.0 1.0 100.0 100.0 100.0
|---VRP---| |--VPN-------||--VUP----| |----COP---| hith yon |--- window------|
|------Light----|
This example contains additional, optional, information for rendering.
Some RayTrace programs use the .nnf Neutral File Format,
plain text file described in nff.txt
Do not confuse this with nff2 or 2.0 that is totally incompatible.
Other file types may be used for texture mapping, terrain, or
backgrounds. For example terrain.bw in SkyFly.
On a different subject, there are a lot of text editors around.
Source code for a Motif version is
w6a.c another of the w*.c collection
Source code for wxPython is in three files (compile in this order):
w6wxbar.py compiles into a .pyc
w6wxed.py compiles into a .pyc
w6wx.py runs the text editor
Python3 used to make cube of 27 smaller cubes:
cube64.py3 source code
cube64.dat makes .dat
without rotation from light_dat.java
The shapes of objects are stored in .dat files for this "run6"
renderer. The cube.dat is
8 6
-0.5 0.5 0.5
0.5 0.5 0.5
0.5 -0.5 0.5
-0.5 -0.5 0.5
-0.5 0.5 -0.5
0.5 0.5 -0.5
0.5 -0.5 -0.5
-0.5 -0.5 -0.5
4 1 2 3 4
4 5 6 2 1
4 8 7 6 5
4 4 3 7 8
4 2 6 7 3
4 5 1 4 8
0.0 0.0 0.0 0.0 0.0 1.0 0.0 1.0 0.0 4.0 6.0 9.0 1.0 -1.0 -1.0 1.0 -1.0 1.0 100.0 100.0 100.0
|---VRP---| |--VPN-------||--VUP----| |----COP---| hith yon |--- window------|
|------Light----|
This example contains additional, optional, information for rendering.
Some RayTrace programs use the .nnf Neutral File Format,
plain text file described in nff.txt
Do not confuse this with nff2 or 2.0 that is totally incompatible.
Other file types may be used for texture mapping, terrain, or
backgrounds. For example terrain.bw in SkyFly.
On a different subject, there are a lot of text editors around.
Source code for a Motif version is
w6a.c another of the w*.c collection
Source code for wxPython is in three files (compile in this order):
w6wxbar.py compiles into a .pyc
w6wxed.py compiles into a .pyc
w6wx.py runs the text editor
Python3 used to make cube of 27 smaller cubes:
cube64.py3 source code
cube64.dat makes .dat
without rotation from light_dat.java
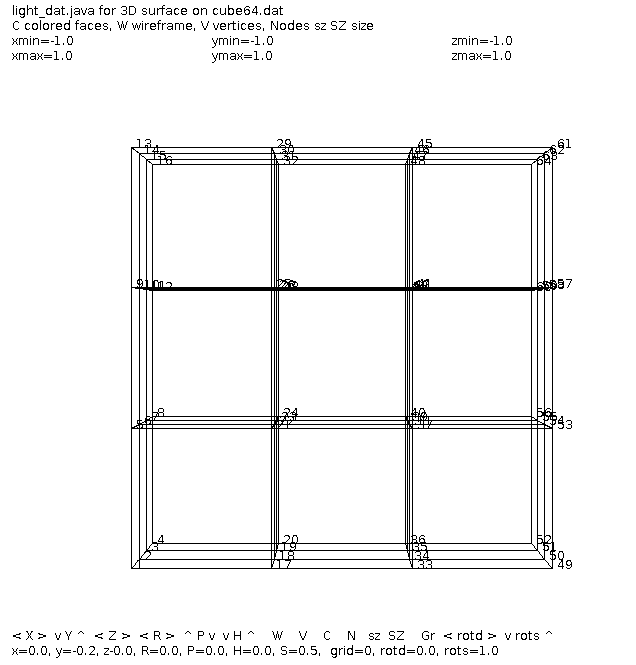 with p and h rotation from light_dat.java
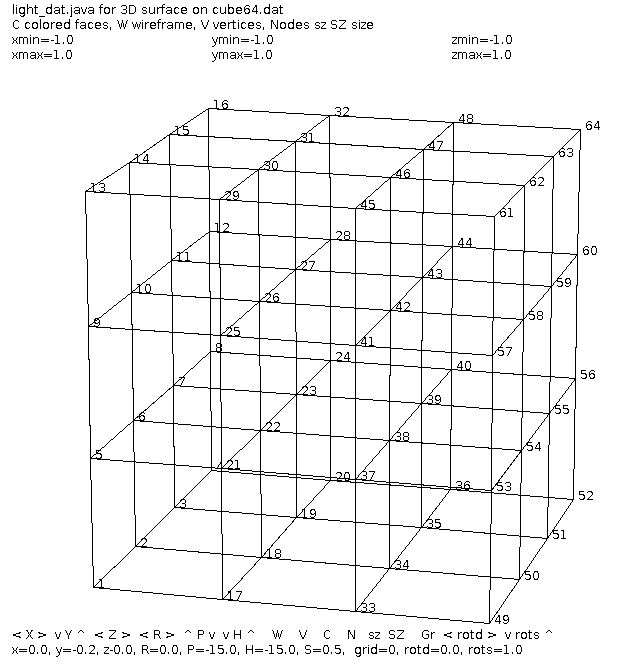 Then a smaller cube made from 8 smaller cubes:
cube27.dat 27 points
Then a smaller cube made from 8 smaller cubes:
cube27.dat 27 points
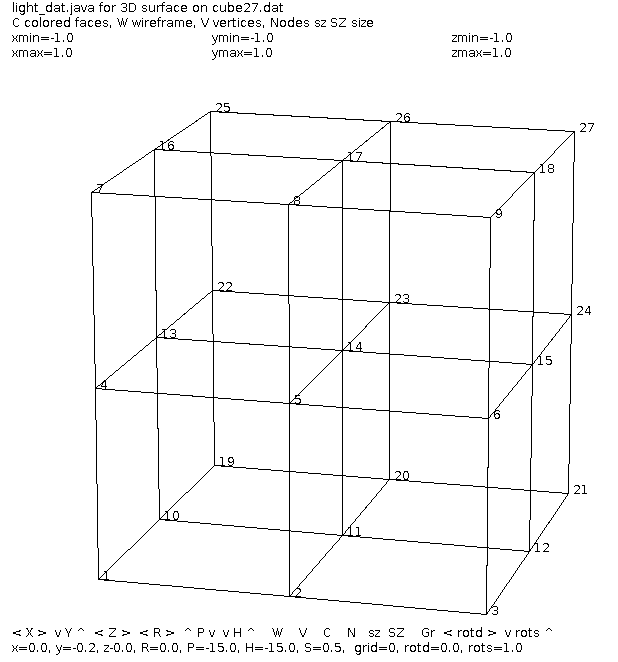 If you think you have trouble saving users work:

Simply stated, "The Painters Algorithm" draws the farthest away objects first.
More technically, the farthest away front facing surface is rendered first.
At an even more detailed level consider the individual pixel that
is farthest away drawn to the display first, then the next closest, etc.
Ooopse:
 In a two dimensional object oriented GUI program, the objects are
typically pointed to by a linked list. This is typically called
the display list. If two objects overlap, the object later on the
linked list is drawn over the object earlier on the linked list.
A typical user menu item is "move to front", that is easily
implemented by unlinking the object from its present position and
relinking the object at the end of the linked list. "move behind" would
unlink the object and relink the object on the front of the linked list.
One 3D implementation works from a different concept.
The basic Z plane algorithm allows objects and surfaces of objects
to be rendered in any order. Each pixel is recorded with RGBA and
the Z coordinate. When a pixel is about to be rendered, the Z coordinate
of the new pixel is compared to the existing Z coordinate. The pixel is
replaced only if the new pixel is closer to the viewer, e.g. has a
larger Z coordinate.
The basic ray casting algorithm determines the RGBA of the first
surface hit by the ray. RGBA pixel comes from surface angles, colors
and light colors.
In OpenGL:
A simple program that you must edit to change 3D objects is
object.c
A more complete program to display the wireframe objects that
are in GLU and GLUT is objects.c
In a two dimensional object oriented GUI program, the objects are
typically pointed to by a linked list. This is typically called
the display list. If two objects overlap, the object later on the
linked list is drawn over the object earlier on the linked list.
A typical user menu item is "move to front", that is easily
implemented by unlinking the object from its present position and
relinking the object at the end of the linked list. "move behind" would
unlink the object and relink the object on the front of the linked list.
One 3D implementation works from a different concept.
The basic Z plane algorithm allows objects and surfaces of objects
to be rendered in any order. Each pixel is recorded with RGBA and
the Z coordinate. When a pixel is about to be rendered, the Z coordinate
of the new pixel is compared to the existing Z coordinate. The pixel is
replaced only if the new pixel is closer to the viewer, e.g. has a
larger Z coordinate.
The basic ray casting algorithm determines the RGBA of the first
surface hit by the ray. RGBA pixel comes from surface angles, colors
and light colors.
In OpenGL:
A simple program that you must edit to change 3D objects is
object.c
A more complete program to display the wireframe objects that
are in GLU and GLUT is objects.c
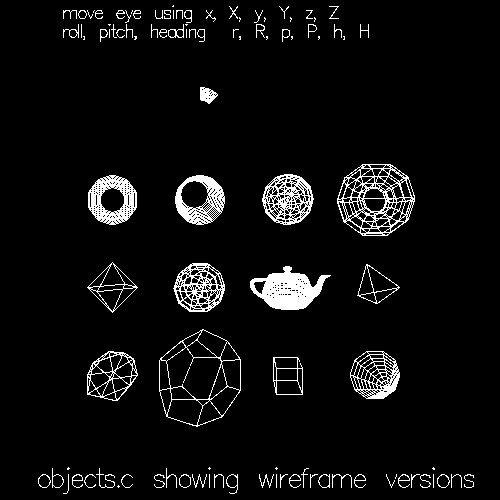 You have control of where the eye is positioned and where the eye
is looking, six degrees of freedom.
Note that for every wire frame you can render the object as a
solid object. Solid objects look best when rendered with lighting.
Hopefully the objects can produce normal vectors so that smooth
shading can be computed.
Consider the problem of having the user select an object with
the mouse. What the user will do with the selected object depends
on the application.
In the 2D world a given screen i,j coordinate may be over no object,
one object or many objects. When the user attempts to select an
object the user must be given a visual clue to know which object
(or point) was selected. The visual clue may be a color or intensity
change, outline, bounding markers, etc.
A poor example pick.c, needs to be run.
A better example pick2.c, needs to be run.
A java AWT version Select.java, needs to be run.
A java swing version Select2.java, needs to be run.
A simpler example is rubber2gl.c, needs to be run.
In order for a user to pick one object out of overlapping objects,
the user is given the "front" object. If this is not the desired
object, the user moves this object to the back and re-selects.
Example: draw program.
In 3D it is more complex and the user may have to be given controls
to rotate the object, as you might turn it in your hand, to see
a specific place unambiguously. Eventually the user is just selecting
an i,j coordinate on the display screen. To get back to find the
object or specific vertex in world coordinates, the program has to
"un-project". That is, go from screen coordinates back to world
coordinates.
The following sequence of programs shows the development of
selecting a specific vertex in 3D world coordinates from a mouse click.
unproject.c OpenGL color change
unproject2.c extensions to find distance to vertex
In a game or puzzle in 3D, you may need the distance from one
object to another. For example first person shooter, FPS,
the distance may be used to generate larger random error.
A possible project is editing 3D objects found in existing files.
Applying 3D unproject to modify 3D images is difficult. It would
probably be applied to the wireframe view.
light_dat2.c application to Utah files
datread.c for read and write of Utah files
datread.h for read and write of Utah files
light_dat.java application to Utah files
datread.java for read and write of Utah files
on cube.dat, drop.dat,
skull.dat, bull.dat
Using special 101 circle, 102 line with arrow, 103 text
circle_dat.dat
You have control of where the eye is positioned and where the eye
is looking, six degrees of freedom.
Note that for every wire frame you can render the object as a
solid object. Solid objects look best when rendered with lighting.
Hopefully the objects can produce normal vectors so that smooth
shading can be computed.
Consider the problem of having the user select an object with
the mouse. What the user will do with the selected object depends
on the application.
In the 2D world a given screen i,j coordinate may be over no object,
one object or many objects. When the user attempts to select an
object the user must be given a visual clue to know which object
(or point) was selected. The visual clue may be a color or intensity
change, outline, bounding markers, etc.
A poor example pick.c, needs to be run.
A better example pick2.c, needs to be run.
A java AWT version Select.java, needs to be run.
A java swing version Select2.java, needs to be run.
A simpler example is rubber2gl.c, needs to be run.
In order for a user to pick one object out of overlapping objects,
the user is given the "front" object. If this is not the desired
object, the user moves this object to the back and re-selects.
Example: draw program.
In 3D it is more complex and the user may have to be given controls
to rotate the object, as you might turn it in your hand, to see
a specific place unambiguously. Eventually the user is just selecting
an i,j coordinate on the display screen. To get back to find the
object or specific vertex in world coordinates, the program has to
"un-project". That is, go from screen coordinates back to world
coordinates.
The following sequence of programs shows the development of
selecting a specific vertex in 3D world coordinates from a mouse click.
unproject.c OpenGL color change
unproject2.c extensions to find distance to vertex
In a game or puzzle in 3D, you may need the distance from one
object to another. For example first person shooter, FPS,
the distance may be used to generate larger random error.
A possible project is editing 3D objects found in existing files.
Applying 3D unproject to modify 3D images is difficult. It would
probably be applied to the wireframe view.
light_dat2.c application to Utah files
datread.c for read and write of Utah files
datread.h for read and write of Utah files
light_dat.java application to Utah files
datread.java for read and write of Utah files
on cube.dat, drop.dat,
skull.dat, bull.dat
Using special 101 circle, 102 line with arrow, 103 text
circle_dat.dat
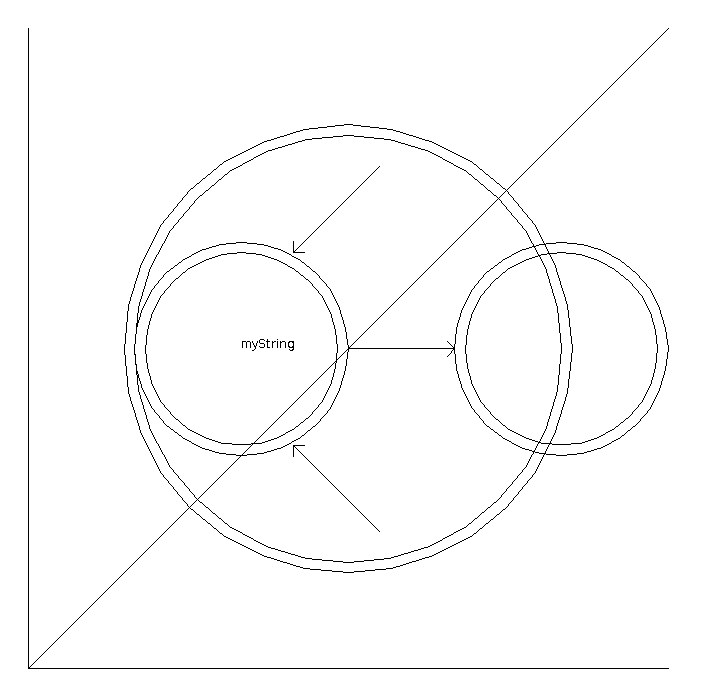 Choices used for this program:
1) automatic scaling of input
2) user option of solid, wire frame or just vertices
3) left to a next version for moving vertices and outputting.
(the code to output the data structure to a file is included)
left to the next version for coloring in the Z direction.
left to the next version for only displaying front half vertices
The next version highlights the selected object.
(reading and writing the .dat file are now in datread.h, datread.c )
Keyboard 's' writes changed object when second file name is selected.
Trimming approximately the back half of the points, 't', was added.
The changing of the object has not been coded in this version. Future
mouse actions would do this.
light_dat3.c application to Utah files
datread.c for read and write of Utah files
datread.h for read and write of Utah files
on cube.dat, drop.dat,
skull.dat
Choices used for this program:
1) automatic scaling of input
2) user option of solid, wire frame or just vertices
3) left to a next version for moving vertices and outputting.
(the code to output the data structure to a file is included)
left to the next version for coloring in the Z direction.
left to the next version for only displaying front half vertices
The next version highlights the selected object.
(reading and writing the .dat file are now in datread.h, datread.c )
Keyboard 's' writes changed object when second file name is selected.
Trimming approximately the back half of the points, 't', was added.
The changing of the object has not been coded in this version. Future
mouse actions would do this.
light_dat3.c application to Utah files
datread.c for read and write of Utah files
datread.h for read and write of Utah files
on cube.dat, drop.dat,
skull.dat
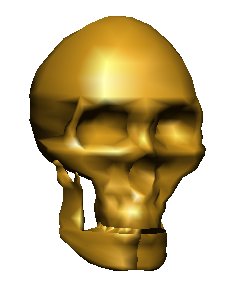 bull.dat
 pot7.dat
mandelbrotgl.c Traditional Mandelbrot with
user selected point to zoom in. Watch "size" at about 10^-15 the floating
point computation collapses and color becomes constant.
Use whatever renderer your tool kit provides. It may be one of
a number of shaders or a ray tracer. Underneath is your representation
of the real world as objects. Well, possibly a mythical world. :)
pot7.dat
mandelbrotgl.c Traditional Mandelbrot with
user selected point to zoom in. Watch "size" at about 10^-15 the floating
point computation collapses and color becomes constant.
Use whatever renderer your tool kit provides. It may be one of
a number of shaders or a ray tracer. Underneath is your representation
of the real world as objects. Well, possibly a mythical world. :)
Cover some loose ends.
Get your term project discussed. Start your project!
Review lectures and homework.
Quiz 1 will be: Open Book, Open Note, Open Computer.
One hour time limit.
(You may bring your own laptop)
(Not the "Study Guide" or copies thereof.)
(Read the instructions and follow the instructions.)
(Read carefully, answer the question that is asked.)
Some questions on concepts. e.g. mouse events, keyboard events, color,
menus, fonts, writing files
Some questions on code. Based on code displayed on course WEB pages.
Questions on color, know the following:
Primary colors for pigment paint, water and oil, are Red, Blue, Yellow.
These are subtractive colors applied to a white background.
Primary colors for computer displays are Red, Green, Blue.
These are additive colors, each may be 0.0 to 1.0 floating point,
or 0 to 255 integer, typically an 8 bit byte.
RGB 0,0,0 is black, 255,255,255 is white, 255,0,0 is red
Primary colors for color printers are Cyan, Magenta, Yellow.
These are subtractive colors applied to a white background.
There is also typically Black.
Color TV uses a very different method, YIQ that has
intensity Y, and uses phase angle IQ for color.
Not all RGB colors can be converted to YIQ.
An RGB image can be shown as gray scale, 0.0 to 1.0,
using 0.299 *R + 0.587 *G + 0.114 *B
with R, G, B in range 0.0 to 1.0
A fourth byte may be used to get 32 bit color, RGBA,
the A is alpha, 0 is transparent, 255 is opaque,
128 or 0.5 allows some of another image to come through.
Toolkits such as OpenGL with GLUT are available on
all operating systems.
Graphics in Java, Python and other languages are
very portable to all operating systems.
Motif is specific to systems with XWindows being
available, including all versions of Unix, Linux, MacOSX.
The painters algorithm, draws from a list, farthest back
object first.
Fonts may appear any size on a computer screen.
Only on paper, properly rendered, is a 72 point font
one inch high. Fonts may be stored in various formats.
Your software may use any font on your computer,
many available, that are in a format your software can read.
A font face many have names such as Times Roman, Helvetica,
Courier, etc. Some are fixed spacing, some are proportional
spacing.
A font type may be bold, italic, outline, underline, and
many others. Not all fonts are available in all types.
tkinter_font.py3 source code
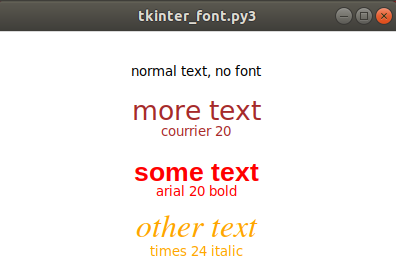 No Email or instant messaging during the exam.
The exam has not been written, thus number of questions unknown,
type of questions unknown. (Typically 40 to 50 questions, many
multiple choice.)
Then, get the big picture:
Our known Universe
No Email or instant messaging during the exam.
The exam has not been written, thus number of questions unknown,
type of questions unknown. (Typically 40 to 50 questions, many
multiple choice.)
Then, get the big picture:
Our known Universe
Based on Lectures 1 through 9.
Based on completed Homework.
See Review 1 for more information
No. Quiz is handed out after lectures. One hour time limit.
quiz is downloaded from class download directory.
Use libreoffice on GL
Use microsoft word on Windows
Sample quiz with instructions, sample answers
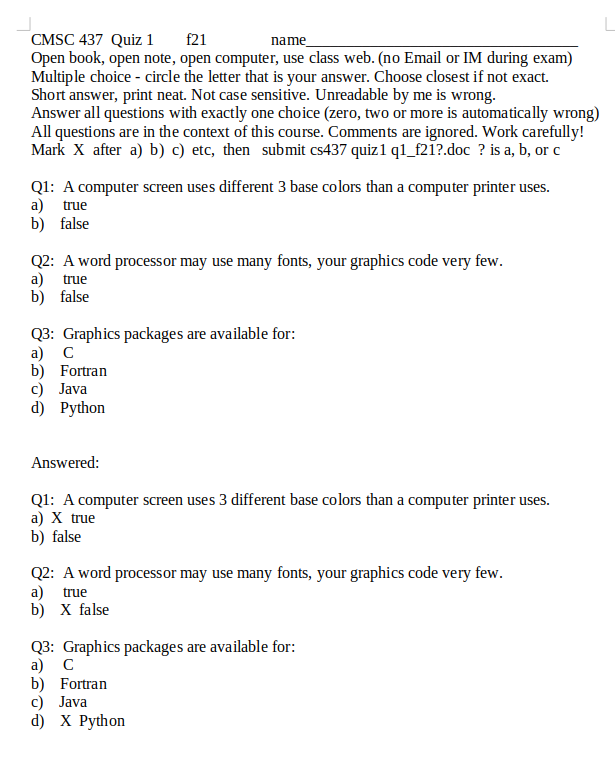 On linux.gl in class download directory:
last name a-j a, last name k-r b, last name s-z c ?
cp /afs/umbc.edu/users/s/q/squire/pub/download/q1_f21a.doc .
cp /afs/umbc.edu/users/s/q/squire/pub/download/q1_f21b.doc .
cp /afs/umbc.edu/users/s/q/squire/pub/download/q1_f21c.doc .
use libreoffice or Microsoft Word to answer
submit quiz1 q1_f21?.doc or .docx
See quiz1 1 for detailed information
On linux.gl in class download directory:
last name a-j a, last name k-r b, last name s-z c ?
cp /afs/umbc.edu/users/s/q/squire/pub/download/q1_f21a.doc .
cp /afs/umbc.edu/users/s/q/squire/pub/download/q1_f21b.doc .
cp /afs/umbc.edu/users/s/q/squire/pub/download/q1_f21c.doc .
use libreoffice or Microsoft Word to answer
submit quiz1 q1_f21?.doc or .docx
See quiz1 1 for detailed information
"Pan" means move the viewport left, right, up, or down. The image
stays in the same place in world coordinates.
"Zoom" in or out by moving the viewer closer to, or farther from the
object or scene. The object or scene stays in the same place in world
coordinates.
To get an idea about "Zoom" ;)
landing simulation
The implementations vary depending on the toolkit being used.
The basic user interface is usually called a "slider". The user
places the mouse on the slide bar and drags the slide bar to
get the desired movement (pan, zoom, scroll, etc).
The GUI programmer must keep the object or scene world coordinates
unmoved and compute the new display requested by the user.
The Motif toolkit provides an option when a drawing area is created
to add horizontal and/or vertical scroll bars. When the user changes
the position of the slider in the scroll bar, the program gets an
event and receives a value that indicates the latest position of
the slide bar. The program must compute the display based on the input.
The computation is not automatic. Java provides a slider that can
be used for a scroll bar. OpenGL can be programmed to display and sense
the position of a slider.
The "look and feel" of Motif scroll bars and zoom slider are shown
in the following screen capture. The user drawing area is empty.
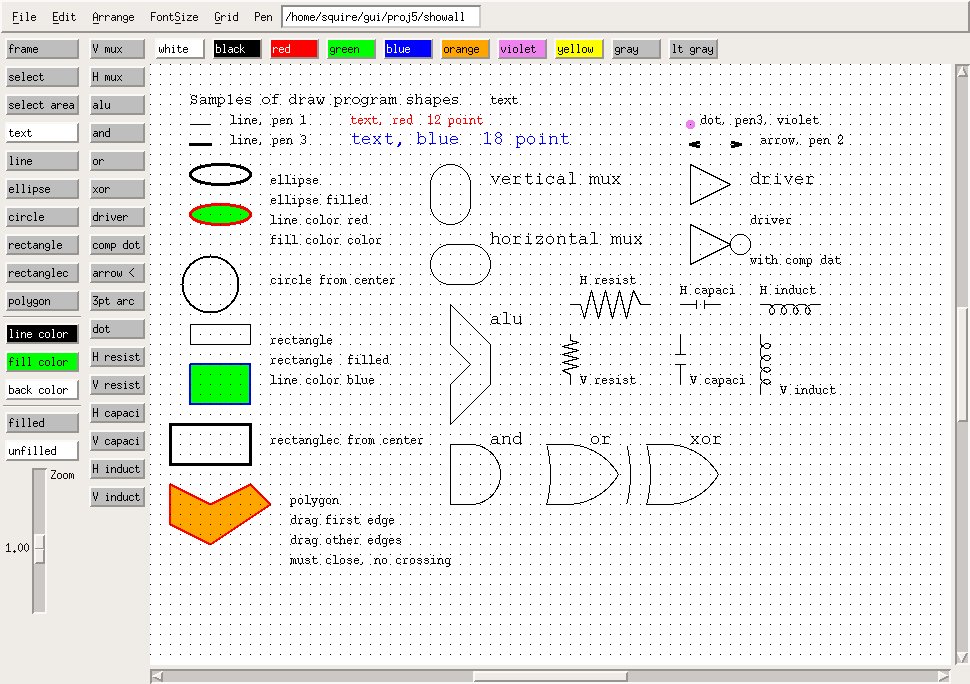 draw_gui.c Motif window setup, big!
May demo ../gui/proj5/draw
Assume the values are from 'smin' to 'smax' on all the slide bars with
the user placing the slide bar at 'spos'. The actual values of 'smin'
and 'smax' are usually settable by the application program.
Consider some point in 2D world coordinates x,y that is mapped to
screen pixel coordinates i,j by:
i = a*x + b*y + c (any complex mapping could be reduced to
j = d*x + e*y + f the six values a, b, c, d, e, and f)
This would be the nominal with all slide bars centered.
Assume all quantities floating point even though pixel coordinates
must eventually rounded to integers (or the intensity of the pixel
is computed based on the pixel coordinates).
The case where the user indicates scroll left, assume 'spos' as a value,
would result in:
new_i = i + (width*(spos-smin)/(smax-smin)-width/2)
More scrolling can be provided by an additional multiplicative constant
times the width. Generally there must be a fixed limit to how far the
user can scroll. Using this simple equation gives the user a double width
working area. To get a four width and height working area:
new_i = i + 2 * (width*(sposx-sminx)/(smaxx-sminx)-width/2)
new_j = j + 2 * (height*(sposy-sminy)/(smaxy-sminy)-height/2)
The case where the user can zoom in to see a larger version of
a smaller part of the working area, assume 'smin', 'smax' and 'spos'
are the slider values and the zoom factor is to be from 'zmin' to 'zmax'.
(you must limit both largest and smallest zoom, always positive)
The 'zval' zoom value is then:
zval = (zmax-zmin)*(spos-smin)/(smax-smin)+zmin
new_new_i = (new_i-width/2) *zval + width/2
new_new_j = (new_j-height/2)*zval + height/2
Note: In order to zoom, the i,j is translated to the center of
the screen, scaled, then translated back. If this is not performed,
then the zooming would also move the screen up and to the left.
The simple equations shown above become much more complex in 3D.
Yet, with a graphics tool kit, it reduces to the following:
To scroll left, move the position of the eye left while keeping
the direction vector unchanged.
To zoom in, move the eye closer to the object or scene.
The next lecture will cover the perspective and model transformations
in more detail, but for now it is sufficient to know that there
are two distinct transformations to get a point on a object in
world coordinates onto the display screen.
There is a perspective matrix that implements the frustum shown
in a previous lecture. This matrix is based on the location of the
eye relative to the scene, the direction the eye is looking, the
field of view, angle, the eye is viewing. The pan and zoom can
be accomplished in this matrix.
The model matrix implements the rotations, scaling and translations
of world coordinates into how the user views the scene. This does
not need to change with pan and zoom.
The scene itself is constructed in world coordinates. Any units of
measure may be used as long as all distances are in the same units.
e.g. microns, feet, kilometers, etc.
The example pilot.c is the basic
demonstration of moving the eye, pilot in this case, through all
six degrees of freedom. X, Y, Z, roll, pitch, heading.
draw_gui.c Motif window setup, big!
May demo ../gui/proj5/draw
Assume the values are from 'smin' to 'smax' on all the slide bars with
the user placing the slide bar at 'spos'. The actual values of 'smin'
and 'smax' are usually settable by the application program.
Consider some point in 2D world coordinates x,y that is mapped to
screen pixel coordinates i,j by:
i = a*x + b*y + c (any complex mapping could be reduced to
j = d*x + e*y + f the six values a, b, c, d, e, and f)
This would be the nominal with all slide bars centered.
Assume all quantities floating point even though pixel coordinates
must eventually rounded to integers (or the intensity of the pixel
is computed based on the pixel coordinates).
The case where the user indicates scroll left, assume 'spos' as a value,
would result in:
new_i = i + (width*(spos-smin)/(smax-smin)-width/2)
More scrolling can be provided by an additional multiplicative constant
times the width. Generally there must be a fixed limit to how far the
user can scroll. Using this simple equation gives the user a double width
working area. To get a four width and height working area:
new_i = i + 2 * (width*(sposx-sminx)/(smaxx-sminx)-width/2)
new_j = j + 2 * (height*(sposy-sminy)/(smaxy-sminy)-height/2)
The case where the user can zoom in to see a larger version of
a smaller part of the working area, assume 'smin', 'smax' and 'spos'
are the slider values and the zoom factor is to be from 'zmin' to 'zmax'.
(you must limit both largest and smallest zoom, always positive)
The 'zval' zoom value is then:
zval = (zmax-zmin)*(spos-smin)/(smax-smin)+zmin
new_new_i = (new_i-width/2) *zval + width/2
new_new_j = (new_j-height/2)*zval + height/2
Note: In order to zoom, the i,j is translated to the center of
the screen, scaled, then translated back. If this is not performed,
then the zooming would also move the screen up and to the left.
The simple equations shown above become much more complex in 3D.
Yet, with a graphics tool kit, it reduces to the following:
To scroll left, move the position of the eye left while keeping
the direction vector unchanged.
To zoom in, move the eye closer to the object or scene.
The next lecture will cover the perspective and model transformations
in more detail, but for now it is sufficient to know that there
are two distinct transformations to get a point on a object in
world coordinates onto the display screen.
There is a perspective matrix that implements the frustum shown
in a previous lecture. This matrix is based on the location of the
eye relative to the scene, the direction the eye is looking, the
field of view, angle, the eye is viewing. The pan and zoom can
be accomplished in this matrix.
The model matrix implements the rotations, scaling and translations
of world coordinates into how the user views the scene. This does
not need to change with pan and zoom.
The scene itself is constructed in world coordinates. Any units of
measure may be used as long as all distances are in the same units.
e.g. microns, feet, kilometers, etc.
The example pilot.c is the basic
demonstration of moving the eye, pilot in this case, through all
six degrees of freedom. X, Y, Z, roll, pitch, heading.
 Typically users are not given roll, pitch and heading so that
the horizontal scroll is X, the vertical scroll is Y and zoom is Z.
Typically users are not given roll, pitch and heading so that
the horizontal scroll is X, the vertical scroll is Y and zoom is Z.
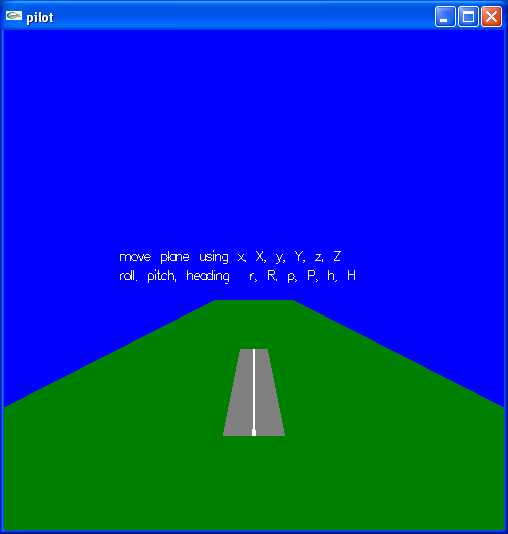 My "draw" program is not fully converted to Java. Starting with
draw.java main prog
Names.java selections
Rectangle.java one selection, rectangle
The Java program PaletteFrame.java calls
MyColorChooser.java that uses JSliders and looks like the image below.
python program to find r,g,b, for your color
color_chooser.py3 that uses mouse and looks like the image below.
My "draw" program is not fully converted to Java. Starting with
draw.java main prog
Names.java selections
Rectangle.java one selection, rectangle
The Java program PaletteFrame.java calls
MyColorChooser.java that uses JSliders and looks like the image below.
python program to find r,g,b, for your color
color_chooser.py3 that uses mouse and looks like the image below.
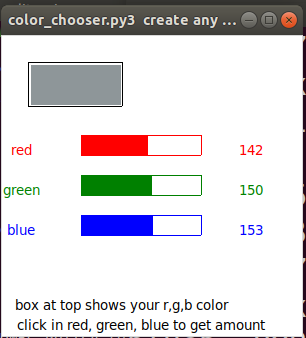 ScrollDemo2.java looks like the image below.
Java automatic pop-into-existence scroll bars is demonstrated by
ScrollDemo2.java looks like the image below.
I personally prefer the scroll bars to be displayed all the time.
It is distracting to me when widgets such as scroll bars pop into
existence then pop out of existence.
ScrollDemo2.java looks like the image below.
Java automatic pop-into-existence scroll bars is demonstrated by
ScrollDemo2.java looks like the image below.
I personally prefer the scroll bars to be displayed all the time.
It is distracting to me when widgets such as scroll bars pop into
existence then pop out of existence.
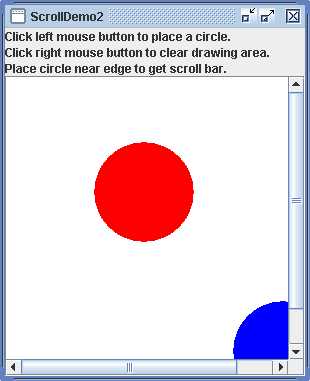 My "draw" program is not converted to Python.
Are these good, average or poor examples of pan and zoom?
HW3 is assigned, select an object with mouse.
Possibly change color of selected object.
Example of mouse use in w2 series of examples.
Select.java simple color change
Best to use the language and tool kit you will use for your project.
My "draw" program is not converted to Python.
Are these good, average or poor examples of pan and zoom?
HW3 is assigned, select an object with mouse.
Possibly change color of selected object.
Example of mouse use in w2 series of examples.
Select.java simple color change
Best to use the language and tool kit you will use for your project.
Suppose you want to update the display at a uniform rate,
independent of the speed of the computer. Assuming the computer
you are using is reasonably fast.
initialize your program
loop
start = get_the_time
cause_display_update
repaint(); in Java
glFlush();
glutSwapBuffers(); in OpenGL
do your calculations that will be used by your paint
or display routine. (Physics, motion, etc.)
loop
now = get_the_time
if ( now > start + your_update_time ) break
end loop
end loop
The above allows for a reasonable variation in the time to
do your calculations.
Double buffering is desirable for smooth motion.
To get the time in "C", unfortunately may be coarse.
time_cpu.c
To get the time of day in C.
time_of_day.c
The output is:
time_of_day.out
To get the time in Java, milliseconds.
time_of_day.java
The output shows all the stuff in "now"
time_of_day.outj
For dynamic display, you may want to follow somewhat
standard design of separating the display from the
physics of the motion. The classic "Three Body Problem"
has three masses, for us, The Sun, Earth and Moon,
and the basic laws of physics.
F = G m1 m2 / d^2 F, A, V, S have x,y,z components
F = m2 v^2 / d d^2 = (x2-x1)^2 + (y2-y1)^2 + (z2-z1)^2
A = F / m1 acceleration along force components
V = V + A dt velocity update at delta time dt
S = S + V dt position update at delta time dt
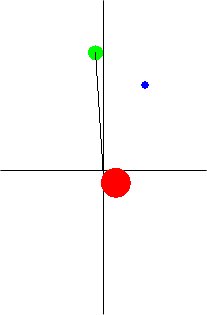 For a simple delay in Java, see "sleep" in thread at end.
body3.java
Basically the Sun, Earth orbiting Sun and Moon orbiting the Earth.
Ummm? Just a little unstable numerically.
Actually, the Earth and Moon are slowly changing their orbit.
The Sun does not have enough mass, thus the Earth moves it a little.
Actually, the planets near alignment do move the Sun a little.
body3 in C, very close to Java version.
body3.c
With a snapshot of the output:
body3.jpg
body3.java
Python thread using tkinter and 2 second delay
threads_tk.py3 source code
For a simple delay in Java, see "sleep" in thread at end.
body3.java
Basically the Sun, Earth orbiting Sun and Moon orbiting the Earth.
Ummm? Just a little unstable numerically.
Actually, the Earth and Moon are slowly changing their orbit.
The Sun does not have enough mass, thus the Earth moves it a little.
Actually, the planets near alignment do move the Sun a little.
body3 in C, very close to Java version.
body3.c
With a snapshot of the output:
body3.jpg
body3.java
Python thread using tkinter and 2 second delay
threads_tk.py3 source code
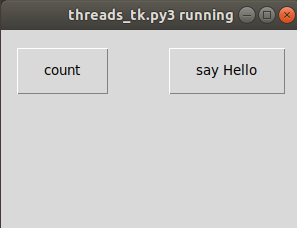 submit quiz1 midnight or later
When using motion, dynamics, in your GUI, think about what
you want to convey.

Russian Fighter, manuvers

 Bears fall down, move mouse

Two choices are cartoon or realism.

The choice of cartoon allows you to violate the laws of
physics. You can squash, stretch and make objects fly
and stop instantaneously. This can be very effective
to impress the viewer.

In order to get realism, the motion needs to approximate
the real world laws of physics. In the simplest terms:
   dt is the time for one screen update
   ds is the distance moved for one screen update
   dv is the change in velocity for one screen update

   s is the objects position (may have 1, 2 or 3 components, x,y,z)
   v is the objects velocity (may have 1, 2 or 3 components)
   a is the acceleration of the object        ( " )
   m is the mass of the object
   f is the force being applied to the object ( " )

Then, given a force, f, compute for each screen:

   a  = f / m     (may have 1, 2 or 3 components)
   dv = a * dt
   v  = v + dv
   ds = v * dt
   s  = s + ds

For a complete set of physics equations and related information
see click on last item, Physics Equations


The short clip, Flatland, is intended to get you thinking about how
people will view your GUI.
Put yourself in the local characters position - what do you see?
Put yourself in the outside observers position - what do you see?

clip Flatland

Notice how Flatlanders move around. like us, they face front
when walking, running, driving. Yet, flip in two dimensions.


Observe the trailers. Do you notice any violations of the laws
of physics? This will be intuitive from your life experience,
not from trying to mentally compute equations.

Note body shape, good for fast rendering of graphics.

the incredibles trailer

Are these cars obeying the laws of physics?
Wall-E trailer

Then, simulation of a construction process. Not real time.
Used to check assembly sequence. The International Space Station,
iss

No gravity International Space Station.
iss

Your project should have either manual, user, speed control or
automatic speed control using clock or some other timing.
Do not expect to get the super performance of movies, unless
you are using a graphics tool kit that uses the graphics card
processor in a near optimum way.
There are many interesting curves and surfaces that are represented
by parametric equations. These may be used in GUI applications.
My reference book is: "CRC Standard Curves and Surfaces" by
David von Seggern, CRC Press, ISBN 0-8493-0196-3.
The uses include defining motion such as the cycloid for
making the robot walk or 3D objects that may be useful or
just interesting.
To understand the examples below, you will have to run the program
read the code. The screen shots are just small samples.
curv_surf.c
The basic idea is to have a standard way to size and parameterize
curves and surfaces. Then a standard set of points can be generated
and these points used either for static drawing or for dynamic
movement, as in a target for a game.
A few simple, crude, codes for spiral and flower:
Spiral.java
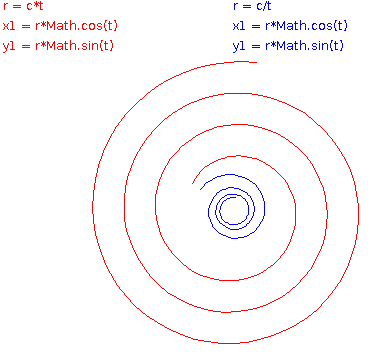 spiral_tk.py3
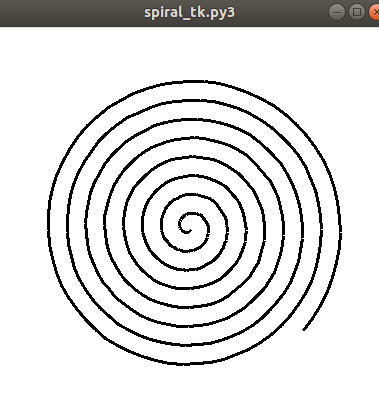 turtle_spiral.py3
 spiral.py3 source code
spiral_py3.dat for making .stl
spiral_py3.stl for 3D printer
flower.java
spiral.py3 source code
spiral_py3.dat for making .stl
spiral_py3.stl for 3D printer
flower.java
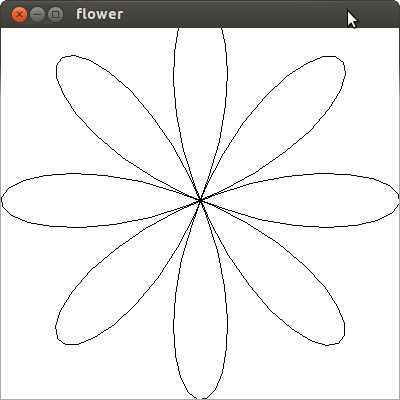 3D surfaces are a bit more complicated.
I tend to write a specific program to generate the 3D surface in
some standard format, I use .dat, then I can combine the 3D objects
into a scene.
make_spiral_635.c is a typical
program to generate a 3D object.
The output is spiral_635.dat which is
not much to look at. The image drawn by light_dat.c is:
3D surfaces are a bit more complicated.
I tend to write a specific program to generate the 3D surface in
some standard format, I use .dat, then I can combine the 3D objects
into a scene.
make_spiral_635.c is a typical
program to generate a 3D object.
The output is spiral_635.dat which is
not much to look at. The image drawn by light_dat.c is:
 spiral_635_3d.py3 source code
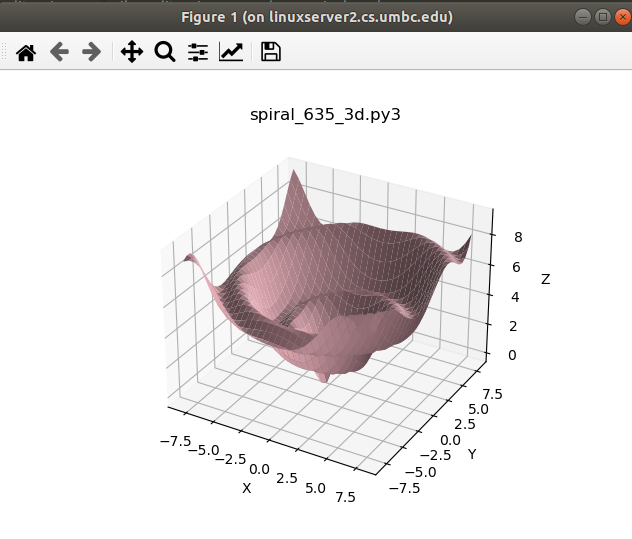 A second example, to see the great similarity, is:
make_helix_635.c is a typical
program to generate a 3D object.
The output is helix_635.dat which is
not much to look at. The image drawn by light_dat.c is:
A second example, to see the great similarity, is:
make_helix_635.c is a typical
program to generate a 3D object.
The output is helix_635.dat which is
not much to look at. The image drawn by light_dat.c is:
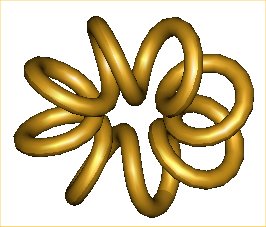 Note that light_dat.c uses datread.h and datread.c
Thus you can read, write and clean the .dat files. Cleaning, removing
redundant vertices, is necessary for good quality rendering when normals
are going to be interpolated.
From the book "Curves and Surfaces" a cylindrical spiral was easily
generated as shown in make_cyl_spiral_635.c
that made the file cyl_spiral_635.dat file displayable in light_dat as:
Note that light_dat.c uses datread.h and datread.c
Thus you can read, write and clean the .dat files. Cleaning, removing
redundant vertices, is necessary for good quality rendering when normals
are going to be interpolated.
From the book "Curves and Surfaces" a cylindrical spiral was easily
generated as shown in make_cyl_spiral_635.c
that made the file cyl_spiral_635.dat file displayable in light_dat as:
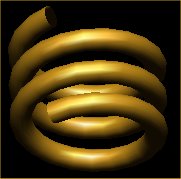 The same code was dropped into an OpenGL program to create surf3d.c showing the object as a wireframe.
Many python examples in my download directory:
shape_tk.py3
The same code was dropped into an OpenGL program to create surf3d.c showing the object as a wireframe.
Many python examples in my download directory:
shape_tk.py3
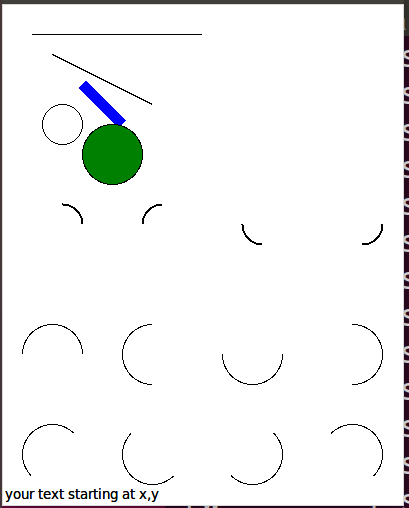 The reason I had so many arcs, I wanted to generate pattern:
shape32.py3
The reason I had so many arcs, I wanted to generate pattern:
shape32.py3
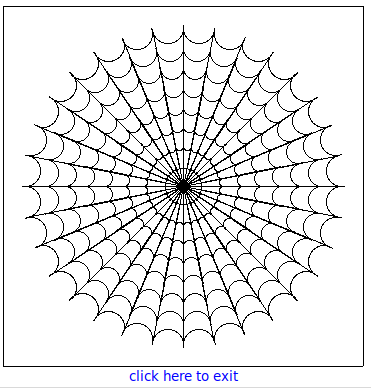 snowflake.py3
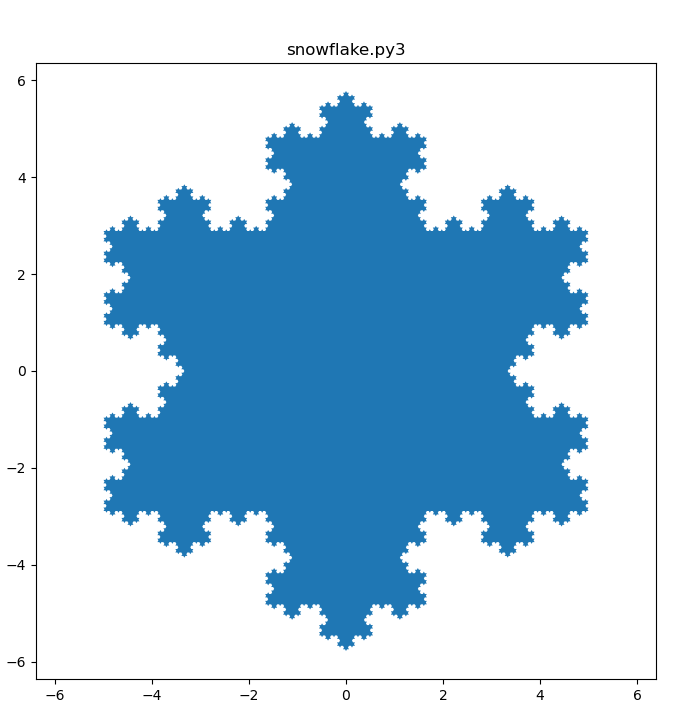 New topic:
There are many ways to run "apps" applications over the Internet in a browser.
Plain HTML can be interactive, Java applets and JavaScript are available
along with many others. Now, some want to go significantly farther.
The goal is to have to complete application on a server rather than
have the user istall the application on their computer. Some will
keep the users data on the same server. Do you trust that?
RIA, Rich Internet Applications, fully interactive that can have
fancy graphics use databases may use AJAX, Asynchronous JavaScript
and Xml, Flash (or Microsofts competing Silverlight) in your browser.
Now, groups are working on the equivalent of AppletViewer that runs
Java Applets without a browser. Mozilla Prism is one of the new
RIA Platforms, for Windows, Linux and MacOSX.
You can not stop progress. HTML 5 is available and Flash 5 is available.
New topic:
There are many ways to run "apps" applications over the Internet in a browser.
Plain HTML can be interactive, Java applets and JavaScript are available
along with many others. Now, some want to go significantly farther.
The goal is to have to complete application on a server rather than
have the user istall the application on their computer. Some will
keep the users data on the same server. Do you trust that?
RIA, Rich Internet Applications, fully interactive that can have
fancy graphics use databases may use AJAX, Asynchronous JavaScript
and Xml, Flash (or Microsofts competing Silverlight) in your browser.
Now, groups are working on the equivalent of AppletViewer that runs
Java Applets without a browser. Mozilla Prism is one of the new
RIA Platforms, for Windows, Linux and MacOSX.
You can not stop progress. HTML 5 is available and Flash 5 is available.
How can you make your graphics run faster?
What takes the time?
Oh, 1) physics to compute new location of objects.
2) AI or other problem solving logic
3) rendering
Ah Ha! multiple processors, at least three, can help.
You probably already have a graphics processor.
How much of its capability is being used
depends on your graphics tool kit.
You may have multiple cores.
How much they are used depends on your program.
In order to understand parallelism, you need some information
on computer architecture and operating system.
A multiple core computer is a "shared memory" system.
All cores get program and data from the same RAM and the
same hard drives and the same CD/DVD's.
Multiple cores can run separate "processes" with each process
having its own memory space. There can be inter-process
communication through the operating system. in general,
think of a process as an individual program.
Multiple cores can run one process that has multiple threads.
All threads in a process share the same address space.
Threads may communicate using memory and also by control
structures within a program.
Threads are one of the easier methods of using a multiple
core computer to speed up a single program such as your
graphics program.
Language support for threads is available to C, C++ and any
language that can call a C library by using pthreads.
Some people think this is too low level, yet you can
get maximum flexibility and maximum speed (if you can
get it working).
Java and Python have threads available. Ada calls them tasks
yet typically uses the underlying pthreads for implementation.
Threads must still have some interaction with the
operating system, because the operating system has full
control of what is running on which core.
I have shown one sample program that used Java threads,
draw3D.java. This was not for speed, but rather to have
a thread for each window. Thus the program was significantly
easier to write and debug. There was no possibility of
deadlock or data corruption.
In order to get a speed up using multiple cores, some
careful planning is required:
Start with double buffering. The display is showing
the previous frame while the program is computing
a future frame.
Assign a thread to do AI or problem solving logic. This is
based on a previous frame and will provide the driving
information to the physics calculations. The new data
must be in a separate buffer, and can not overwrite data
that may be in use.
Assign one thread to do motion calculations, the physics.
Data on all objects from a previous frame are in RAM.
The new data for all objects is computed and stored in
a separate place in RAM, ready to be used.
Use the GPU, Graphics Processing Unit, to render, shade,
the next frame. There is probably double buffering inside
the GPU so that the entire newly rendered frame is
written to the display as one image.
These threads are scheduled and each gets its assigned
old and new buffers. Not hard to program.
Then, there is the asynchronous thread. The thread receiving
user inputs. This must carefully insert the information
from the user at the start of a AI thread and allow the
ongoing work of other threads to continue. Here,
synchronizing may get complex.
May demonstrate java -cp . RunThread
A simple example of Java threads, demonstrated using four windows,
is RunThread.java
A simple example of Python threads, with no windows,
is thread_example.py
The output is thread_example_py.out
More complex, using barriers:
barrier_test.py
barrier_test_py.out
May demonstrate python worker_threads.py
Another simple example of Python threads, using a window to
start threads is worker_threads.py
May demonstrate ssh -Y maya.umbc.edu ...
A not so simple example using MPI on a massively parallel computer,
or as demonstrated, using 4 computers in a cluster, is
w1mpi.c
You do not have to memorize your physics text book, yet you
should be able to look up basic equations. If all else fails,
check my WEB page here.
May demonstrate frogger
My crude cut at "frogger" with mouse action at various speeds.
Note logs coming out of waterfall. Water some day.
No 'gators yet.
Now, choice of mouse click on where frog is to jump.
Thus, can test if on log or in water, take different actions.
frogger.c
More physics and dynamics in various "spring" files.
This was a prototype for an education module for
High School physics.
Note drawing of spring used prior "curves and surfaces"
F = k * x for spring (note heuristics)
a = F/m see "physics" in code
v = v + a * dt
x = x + v * dt dt is delta time, the time step for each frame
Note buttons show what will happen if you click.
The text changes after you click.
Note heavy objects should look heavier.
Stronger springs should look stronger.
Give the user good visual clues in your GUI.
Run sequence gl,2gl,3gl, .java, db.java double buffered
springgl.c
spring2gl.c
spring3gl.c
Spring.java
Springdb.java smoother
spring.c Motif
May demonstrate racegl
Around the track, the physics and geometry of a race track.
Note incline on curves. (See code in "build_track")
Note navigation around curves. (See code in "drive")
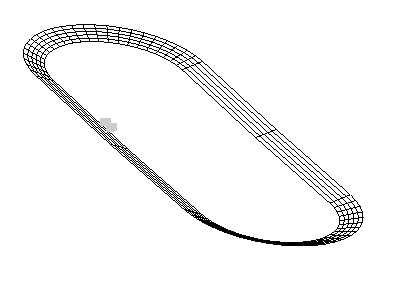 racegl.c
More threads with printing time
thread_more.py3 source
thread_more_py3.out
racegl.c
More threads with printing time
thread_more.py3 source
thread_more_py3.out
Given that you can get a 3D scene rendered, you may want:
a) to have the user move the scene or
b) have the user move (the location of the users eye).
The minor difference is that moving the scene left gives the
eye the impression that the scene is moving to the left.
Whereas, moving the direction the eye is looking to the left
gives the brain the impression the scene is moving to the right.
Be careful of the plus or minus sign on rotation matrices.
Modeling and Simulation
There are six degrees of freedom of motion and the problem
for the GUI programmer is how to make it convenient and intuitive
for the user. My example code using the keyboard for x,y,z r,p,h
in pilot.c is very hard to use and
does not represent the controls in an airplane.
Remember! All free objects rotate about their center of gravity.
The Longitudinal, Lateral and Vertical axes all pass through
the center of gravity. Position, Velocity and Acceleration are
applied to the center of gravity. The rendering then draws
relative to the six degrees of freedom about the center of
gravity.
Incomplete aircraft, step by step 8 rool, 8 pitch, 8 yaw.
Requires 24 clicks to see all.
test_rotate.py3 test source code
test_rotate_py3.out
plot3dp.py3 source code
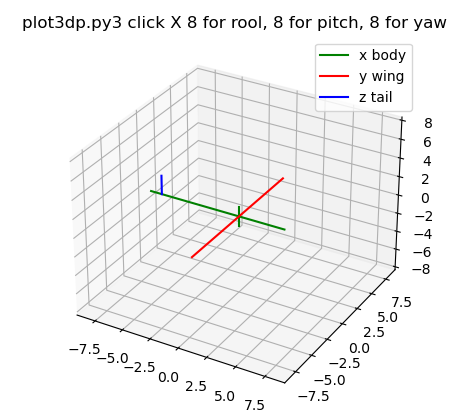 Russian Fighter, manuvers
FYI. A typical small airplane has a yoke with what looks like a steering
wheel that can also move forward and backward. The foot pedals
move in opposite directions, right down causes left up. This only provides
control of three (3) degrees of freedom, yet is sufficient for the
pilot to fly the airplane. Turning the wheel causes roll (ailerons move),
pushing the wheel causes pitch (elevators move) and pushing the
petals causes yaw (rudder moves). The airplane is turned
by causing roll with small compensating pitch to maintain constant
altitude (changes x,y). Performed properly, this is called a coordinated
turn. The radius of the turn may be defined as "g" force, the equivalent
force of gravity pushing the pilots down into their seats.
The airplane changes altitude using the pitch control
(changes z). Of course the airplane must be moving to stay in the air,
thus some velocity vector in x,y,z determines the direction of motion.
The typical way to model the flight of an airplane is to consider
the airplane to be at position x,y,z at some time "t". The airplane
has some velocity vector vx,vy,vz and the pilots three controls
in conjunction with the airplanes aerodynamics determine the
acceleration vector ax,ay,az. Then at some delta time later "t+dt"
the position is updated x,y,x = x,y,z + dt * vx,vy,vx and
velocity is updated vx,vy,vz = vx,vy,vz + dt * ax,ay,az .
Similar updates are computer for the angles roll, pitch and
yaw (not really heading). Angular velocities are vr,vp,vy and
angular accelerations ar,ap,ay are computed based on the
pilots three controls in conjunction with the airplanes aerodynamics.
Then at some delta time later "t+dt" the roll, pitch, yaw angles
are updated r,p,y = r,p,y + dt * vr,vp,vy and
angular velocities are updated vr,vp,vy = vr,vp,vy + dt * ar,ap,ay .
The basis of motion is from calculus:
velocity(time T) = velocity(time 0)
+ integral from 0 to T acceleration(t) dt
position(time T) = position(time 0)
+ integral from 0 to T velocity(t) dt
The discrete numerical calculation approximates the analytic expression
using small discrete time steps, dt, and simple multiplication and addition.
There is, of course, a fourth control: the throttle and the brakes that
are primarily used for takeoff and landing. This control contributes
to the acceleration along the longitudinal axis of the airplane.
Technically, the positions, velocities and accelerations are all
computed at the center of gravity of the airplane. The longitudinal,
lateral and vertical axes pass through the airplanes center of
gravity. For graphic rendering, particularly at takeoff and landing,
compensation must be made for height of the center of gravity above
the ground.
OK, so how are the accelerations computed?
It boils down to Sir Isaac Newton, F = m a .
Force equals mass times acceleration. Given that we know the weight
of the airplane, we can compute the airplanes mass, m.
Then, from the throttle position, we can fit a low degree polynomial
to give the force (called thrust) as a function of throttle position
and velocity. Thus, we compute the acceleration along the longitudinal
axis from a = F/m and resolve the force into ax,ay,az.
Multiple forces add and thus multiple accelerations add.
The force in the direction opposite thrust is called drag. Drag is
computed based on the coefficient of drag, Cd, that is a function
of the physical shape of the airplane, multiplied by air density,
surface area of the airplane, and velocity squared over 2. The force
along the vertical axis, in the up direction is called lift. Lift is
computed based on coefficient of lift, Cl, that is a function of the
physical shape of the airplane, multiplied by air density, surface
area of the airplane times velocity squared then divided by 2.
D = Cd * r * Area * V^2 / 2 where r depends on air density and units
L = Cl * r * Area * V^2 / 2 e.g. r = 0.00237 slugs/cu ft
The roll, pitch and yaw angular acceleration are typically modeled
by low degree polynomials on the respective control position, multiplied
by velocity squared (For small aircraft well below Mach 1.0).
Thus, there are many, relatively simple, steps to compute the
aircraft's 3D position verses time and render the aircraft's motion.
Additional GUI user control may be desired to allow for the pilot
to look left and right, up and down. This addition becomes a user
interface problem on most standard computers.
One possible user interface is a "wheel mouse". The left-right
mouse motion is interpreted as roll left-right. The forward-back
mouse motion is interpreted as pitch down-up. The center wheel
motion forward-back is interpreted as rudder position left-right.
Throttle and brakes must be input from the keyboard. Anyone who
has flown a small aircraft or a radio control aircraft understands
the awkwardness of the computer GUI. The radio control interface
is two joy sticks (left thumb and right thumb) controlling
rudder-throttle and roll-pitch.
A little hard to read, for a specific wing shape, the chart shows
Cl and Cd as a function of angle of attack. The angle of attack is
the angle between the chord of the wing and the velocity vector.
Russian Fighter, manuvers
FYI. A typical small airplane has a yoke with what looks like a steering
wheel that can also move forward and backward. The foot pedals
move in opposite directions, right down causes left up. This only provides
control of three (3) degrees of freedom, yet is sufficient for the
pilot to fly the airplane. Turning the wheel causes roll (ailerons move),
pushing the wheel causes pitch (elevators move) and pushing the
petals causes yaw (rudder moves). The airplane is turned
by causing roll with small compensating pitch to maintain constant
altitude (changes x,y). Performed properly, this is called a coordinated
turn. The radius of the turn may be defined as "g" force, the equivalent
force of gravity pushing the pilots down into their seats.
The airplane changes altitude using the pitch control
(changes z). Of course the airplane must be moving to stay in the air,
thus some velocity vector in x,y,z determines the direction of motion.
The typical way to model the flight of an airplane is to consider
the airplane to be at position x,y,z at some time "t". The airplane
has some velocity vector vx,vy,vz and the pilots three controls
in conjunction with the airplanes aerodynamics determine the
acceleration vector ax,ay,az. Then at some delta time later "t+dt"
the position is updated x,y,x = x,y,z + dt * vx,vy,vx and
velocity is updated vx,vy,vz = vx,vy,vz + dt * ax,ay,az .
Similar updates are computer for the angles roll, pitch and
yaw (not really heading). Angular velocities are vr,vp,vy and
angular accelerations ar,ap,ay are computed based on the
pilots three controls in conjunction with the airplanes aerodynamics.
Then at some delta time later "t+dt" the roll, pitch, yaw angles
are updated r,p,y = r,p,y + dt * vr,vp,vy and
angular velocities are updated vr,vp,vy = vr,vp,vy + dt * ar,ap,ay .
The basis of motion is from calculus:
velocity(time T) = velocity(time 0)
+ integral from 0 to T acceleration(t) dt
position(time T) = position(time 0)
+ integral from 0 to T velocity(t) dt
The discrete numerical calculation approximates the analytic expression
using small discrete time steps, dt, and simple multiplication and addition.
There is, of course, a fourth control: the throttle and the brakes that
are primarily used for takeoff and landing. This control contributes
to the acceleration along the longitudinal axis of the airplane.
Technically, the positions, velocities and accelerations are all
computed at the center of gravity of the airplane. The longitudinal,
lateral and vertical axes pass through the airplanes center of
gravity. For graphic rendering, particularly at takeoff and landing,
compensation must be made for height of the center of gravity above
the ground.
OK, so how are the accelerations computed?
It boils down to Sir Isaac Newton, F = m a .
Force equals mass times acceleration. Given that we know the weight
of the airplane, we can compute the airplanes mass, m.
Then, from the throttle position, we can fit a low degree polynomial
to give the force (called thrust) as a function of throttle position
and velocity. Thus, we compute the acceleration along the longitudinal
axis from a = F/m and resolve the force into ax,ay,az.
Multiple forces add and thus multiple accelerations add.
The force in the direction opposite thrust is called drag. Drag is
computed based on the coefficient of drag, Cd, that is a function
of the physical shape of the airplane, multiplied by air density,
surface area of the airplane, and velocity squared over 2. The force
along the vertical axis, in the up direction is called lift. Lift is
computed based on coefficient of lift, Cl, that is a function of the
physical shape of the airplane, multiplied by air density, surface
area of the airplane times velocity squared then divided by 2.
D = Cd * r * Area * V^2 / 2 where r depends on air density and units
L = Cl * r * Area * V^2 / 2 e.g. r = 0.00237 slugs/cu ft
The roll, pitch and yaw angular acceleration are typically modeled
by low degree polynomials on the respective control position, multiplied
by velocity squared (For small aircraft well below Mach 1.0).
Thus, there are many, relatively simple, steps to compute the
aircraft's 3D position verses time and render the aircraft's motion.
Additional GUI user control may be desired to allow for the pilot
to look left and right, up and down. This addition becomes a user
interface problem on most standard computers.
One possible user interface is a "wheel mouse". The left-right
mouse motion is interpreted as roll left-right. The forward-back
mouse motion is interpreted as pitch down-up. The center wheel
motion forward-back is interpreted as rudder position left-right.
Throttle and brakes must be input from the keyboard. Anyone who
has flown a small aircraft or a radio control aircraft understands
the awkwardness of the computer GUI. The radio control interface
is two joy sticks (left thumb and right thumb) controlling
rudder-throttle and roll-pitch.
A little hard to read, for a specific wing shape, the chart shows
Cl and Cd as a function of angle of attack. The angle of attack is
the angle between the chord of the wing and the velocity vector.
 Lift equations
Local copies at
NACA-460 1933 78 airfoils and
NACA-824 1945 Airfoil Summary
The reference material comes from NACA the predecessor of NASA.
NACA-460 1933 78 airfoils and
NACA-824 1945 Airfoil Summary and
A crude airplane can be generated and manually moved,
the usual x, y, z, roll, pitch, heading:
Lift equations
Local copies at
NACA-460 1933 78 airfoils and
NACA-824 1945 Airfoil Summary
The reference material comes from NACA the predecessor of NASA.
NACA-460 1933 78 airfoils and
NACA-824 1945 Airfoil Summary and
A crude airplane can be generated and manually moved,
the usual x, y, z, roll, pitch, heading:
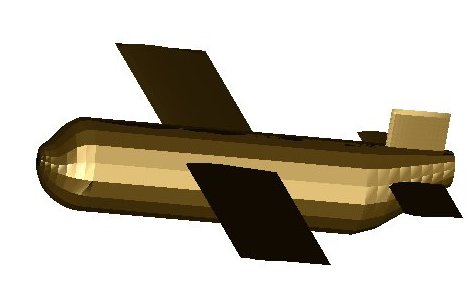 This could be modified to be "flown" using a script
or the user moving the mouse. A background could be
added and coloring and decorations added to the plane.
plane2gl.c
plane_fuse.h
This could be modified to be "flown" using a script
or the user moving the mouse. A background could be
added and coloring and decorations added to the plane.
plane2gl.c
plane_fuse.h
Accurate Modeling and Simulation
Of course, this is not the end of the complexity of accurate modeling
and simulation. When a person moves a control, that signal typically
goes to a servo, which sends signals to the actuator to move the
physical object the person wants to control. A servo works on the
principal of measuring where the physical object is, x, how the
physical object is moving, vx, and the persons desired position xp.
There is some time lag as the servo drives the physical object
to make x equal to xp. This is known as a servo loop or control loop.
In general, human factors requires that the person be provided a
control for position or angle rather that acceleration. Embedded
computers or electro-mechanical devices cause the persons control
signal to be translated to a force that in turn causes acceleration
that ultimately causes the physical device to reach the commanded
position.
Many planes to model:
Top 10
HW4 is assigned, display fonts.
Kinematics, how to compute and present movement from one given
position and orientation to another position and orientation.
This lecture covers the graphics display and timing control for
a motion path generated by a control system.
One example is computing the path for a two drive wheel robot:
Have starting coordinate and direction,
specify ending coordinate and direction, self driving.
(I wrote this code in 2005, may need automated wheel chair?)
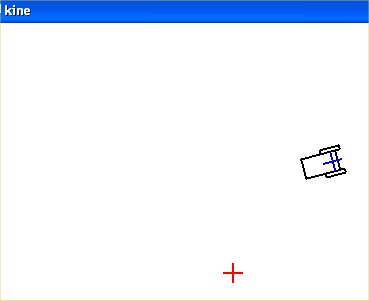 The basic control system is given by the code:
/* kine.c from CH 3 S&N Autonomous Mobile Robots */
/* given starting position, goal is origin, control vector */
/* navigate to goal. From any x0,y0 to x1,y1 OK, just compute dx,dy */
/* chosen control parameters */
static double kr = 3.0, ka = 8.0, kb = -3.0;
/* compute deltas from control system */
drho = -kr*rho*cos(alpha);
dalpha = kr*sin(alpha) - ka*alpha - kb*beta;
dbeta = -kr*sin(alpha);
dtheta = -(dbeta+dalpha);
/* robot has to move distance drho*dt */
/* at angle theta+dtheta*dt */
dx = dx + drho*dt*cos(theta+dtheta*dt);
dy = dy + drho*dt*sin(theta+dtheta*dt);
rho = sqrt(dx*dx+dy*dy);
theta = theta+dtheta*dt;
alpha = -(theta - atan2(dy, dx));
beta = -(theta + alpha);
t = t+dt; /* simulation time */
kine.c Simple linear control system
The basic control system is given by the code:
/* kine.c from CH 3 S&N Autonomous Mobile Robots */
/* given starting position, goal is origin, control vector */
/* navigate to goal. From any x0,y0 to x1,y1 OK, just compute dx,dy */
/* chosen control parameters */
static double kr = 3.0, ka = 8.0, kb = -3.0;
/* compute deltas from control system */
drho = -kr*rho*cos(alpha);
dalpha = kr*sin(alpha) - ka*alpha - kb*beta;
dbeta = -kr*sin(alpha);
dtheta = -(dbeta+dalpha);
/* robot has to move distance drho*dt */
/* at angle theta+dtheta*dt */
dx = dx + drho*dt*cos(theta+dtheta*dt);
dy = dy + drho*dt*sin(theta+dtheta*dt);
rho = sqrt(dx*dx+dy*dy);
theta = theta+dtheta*dt;
alpha = -(theta - atan2(dy, dx));
beta = -(theta + alpha);
t = t+dt; /* simulation time */
kine.c Simple linear control system
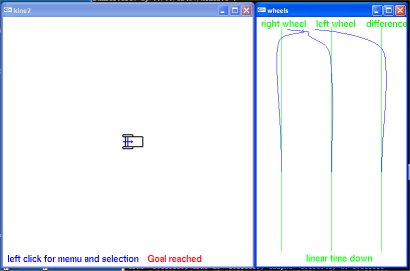 Add the output of individual wheel speeds that could drive the
robots wheels.
kine2.c Displaying individual wheel speeds
Add the output of individual wheel speeds that could drive the
robots wheels.
kine2.c Displaying individual wheel speeds
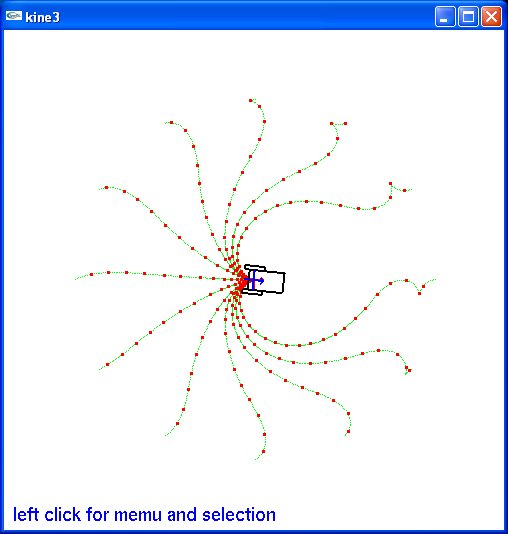 Now test from various starting points at various starting angles.
kine3.c Showing 8 starting points to end 0,0
Now test from various starting points at various starting angles.
kine3.c Showing 8 starting points to end 0,0
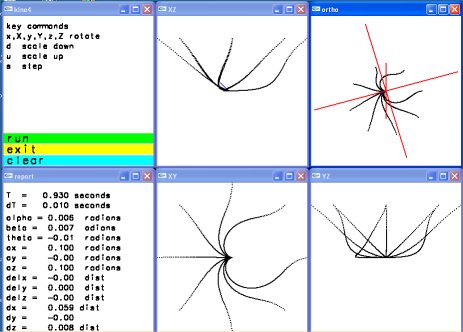 The control system can be made to operate in a three dimensional
scene by adding Z axis convergence.
kine4.c Three dimensional paths
The basic control system can be implemented in any language with
a choice of graphics library for display.
Kine.java
Techniques for developing interactive graphics applications from
some starting code.
robot.c I considered not much to talk about robot.jpg
It did have mouse control and the "robot" arm did move under user control.
There was a ready made addition available:
dynamic.c starting point of robot2.c was hard to read. dynamic.jpg
My approach was to copy dynamic.c to robot2.c and make the following
changes, in order, compiling (fixing) and running (fixing) each change.
I could not see the lower leg from the upper leg, thus I changed the
colors for various body parts. Since this was a 'lighting' scene,
it was a matter of changing the emitted light to white and covering
the various limbs with material of various colors.
Now that I could see the motion better, I wanted to make the robot
bend, not just turn. Yuk! The code used numbers, 1, 2, 3 ... rather
than named numbers for the angles. Thus I went through and changed
all references, menu, angle[?] and a few others to names, #define's.
This really helped me understand the code because I had to look
at every section.
With menu and angles and rotations named, it was easy to add two
menu items, one to increase motion per click, another to decrease
motion per click.
Now it was easy to add bend to the torso because I had seen that
the head could both rotate and bend, just cut-and-paste with some
name changing.
When I lifted both legs, the robot did not lower itself, unreal.
Thus I added keyboard function for 'x', 'X', 'y' and 'Y' so the
robot could be moved.
robot2.c was an interesting exercise for me to develop. robot2.jpg
Now I could add the upper limbs, shoulder hip, to both
rotate up and down and sideways like real limbs. Then add "hands"
with future some kind of grip. Then be able to read and save a
script of a sequence of motions.
robot3.c add hands and ball joint at shoulder. robot3.jpg
A possible future project is to implement a "record" mode where a user
moves the robots limbs to make the robot walk, run, dance, jump etc.
Then a "play" mode where the robot performs the recorded motions.
A typical data structure for each move might have:
sequence number
mode (just move, interpolate, repeat sequence)
delta time for move
x coordinate
y coordinate
z coordinate
number of joints to move
joint angle
joint angle
...
or an optional repeat sequence
sequence number
delta time for move
mode repeat sequence
from sequence number
to sequence number
If the "record" kept an ASCII text file, the user could edit
the action and potentially have a computer program generate
the motions.
User interface buttons similar to those found on VCR or DVD
recorders would seem appropriate.
The robot could be replaced by a more human figure, an animal
or some pseudo figure like a car, truck or machine that could
do non characteristic actions. e.g. cartoon characters.
So far, a small data file may look like:
robot3.dat
Using Java, Thread.sleep(100); for 100 millisecond delay of Rocket.
Rocket_flight.java
Project testing and demonstrations, if any are ready.
on GL in /cs437 robot3 robot3.dat
The control system can be made to operate in a three dimensional
scene by adding Z axis convergence.
kine4.c Three dimensional paths
The basic control system can be implemented in any language with
a choice of graphics library for display.
Kine.java
Techniques for developing interactive graphics applications from
some starting code.
robot.c I considered not much to talk about robot.jpg
It did have mouse control and the "robot" arm did move under user control.
There was a ready made addition available:
dynamic.c starting point of robot2.c was hard to read. dynamic.jpg
My approach was to copy dynamic.c to robot2.c and make the following
changes, in order, compiling (fixing) and running (fixing) each change.
I could not see the lower leg from the upper leg, thus I changed the
colors for various body parts. Since this was a 'lighting' scene,
it was a matter of changing the emitted light to white and covering
the various limbs with material of various colors.
Now that I could see the motion better, I wanted to make the robot
bend, not just turn. Yuk! The code used numbers, 1, 2, 3 ... rather
than named numbers for the angles. Thus I went through and changed
all references, menu, angle[?] and a few others to names, #define's.
This really helped me understand the code because I had to look
at every section.
With menu and angles and rotations named, it was easy to add two
menu items, one to increase motion per click, another to decrease
motion per click.
Now it was easy to add bend to the torso because I had seen that
the head could both rotate and bend, just cut-and-paste with some
name changing.
When I lifted both legs, the robot did not lower itself, unreal.
Thus I added keyboard function for 'x', 'X', 'y' and 'Y' so the
robot could be moved.
robot2.c was an interesting exercise for me to develop. robot2.jpg
Now I could add the upper limbs, shoulder hip, to both
rotate up and down and sideways like real limbs. Then add "hands"
with future some kind of grip. Then be able to read and save a
script of a sequence of motions.
robot3.c add hands and ball joint at shoulder. robot3.jpg
A possible future project is to implement a "record" mode where a user
moves the robots limbs to make the robot walk, run, dance, jump etc.
Then a "play" mode where the robot performs the recorded motions.
A typical data structure for each move might have:
sequence number
mode (just move, interpolate, repeat sequence)
delta time for move
x coordinate
y coordinate
z coordinate
number of joints to move
joint angle
joint angle
...
or an optional repeat sequence
sequence number
delta time for move
mode repeat sequence
from sequence number
to sequence number
If the "record" kept an ASCII text file, the user could edit
the action and potentially have a computer program generate
the motions.
User interface buttons similar to those found on VCR or DVD
recorders would seem appropriate.
The robot could be replaced by a more human figure, an animal
or some pseudo figure like a car, truck or machine that could
do non characteristic actions. e.g. cartoon characters.
So far, a small data file may look like:
robot3.dat
Using Java, Thread.sleep(100); for 100 millisecond delay of Rocket.
Rocket_flight.java
Project testing and demonstrations, if any are ready.
on GL in /cs437 robot3 robot3.dat
The user interface includes visual and sound output.
The user interface includes keyboard, mouse, touch, multi-touch input.
Human reaction times and visual cues.
Style, conventions and standards differ with application.
Platforms:
1) desktop, laptop, tablet computers
both application and web interface
Windows, Mac OSX, Unix, Linux, differences
2) game consoles
WII, PlayStation 3,4 , XBox 360, one
game controllers
3) cell phones
touch methods, size, speed, resolution
4) Automotive, aircraft "glass cockpit"
replacing traditional instruments with a display
5) RPV, remotely piloted vehicle
flying over Afghanistan from Colorado
6) Internationalization
marketing around the world
7) real 3D displays
cameras, games, TV, graphics
Think about a touch screen vs a mouse.
Are you going to require a very small stylus?
Are you going to require a normal stylus?
Are you going to allow fat fingered me?
Personally, I am required to use a stylus for most
selections on my iPhone 5. e.g. keyboard,
edit, delete, etc. buttons.
Only apps seem big enough to reliably press with finger.
If you provide buttons to press and select, the size of
the buttons are determined by screen size, screen resolution,
and what you are requiring of the user.
Then, you must consider single touch vs multi touch.
With multi touch, you can allow the user two fingers to
make smaller, make larger, rotate, ...
Games can make use of multi touch screens.
You can add touch screen film or plate to existing displays.
Touch Screen Film
Resistive or Capacitive add on USB Touch Screen
Surface and everyones app selection
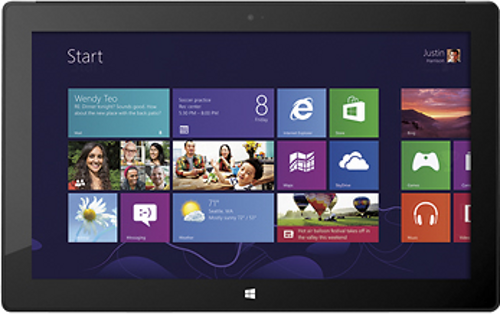 Keyboards are similar yet not completely standardized.
Examples are:
iPad landscape orientation, finger usable.
Keyboards are similar yet not completely standardized.
Examples are:
iPad landscape orientation, finger usable.
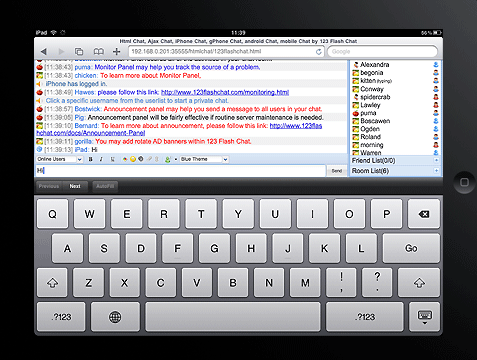 configurable iPhone iSSH app, best with stylus
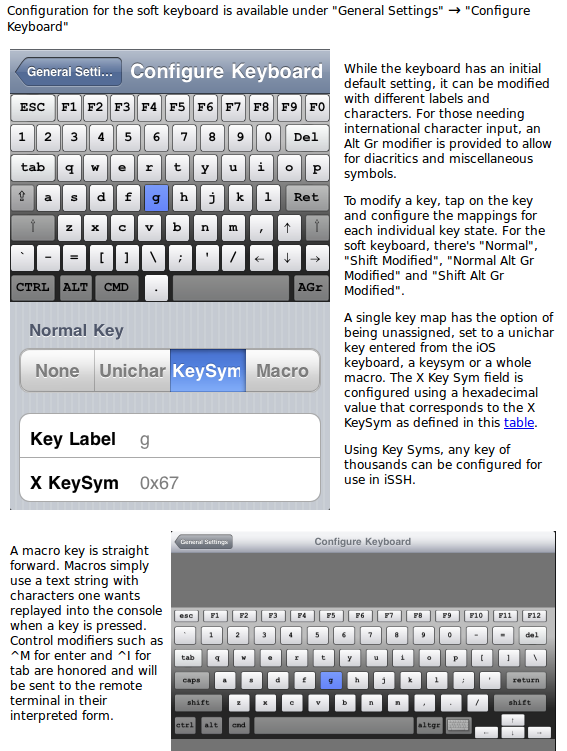 Big, easy to identify buttons/objects on car screen
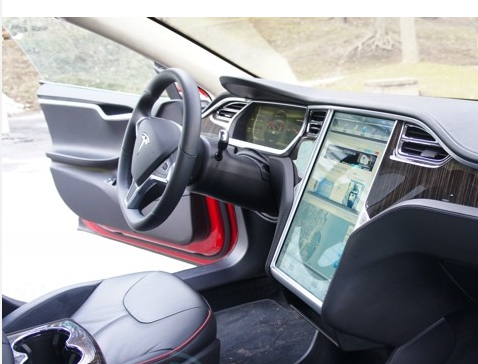 Then voice control is here:
iPhone Siri
Then voice control is here:
iPhone Siri
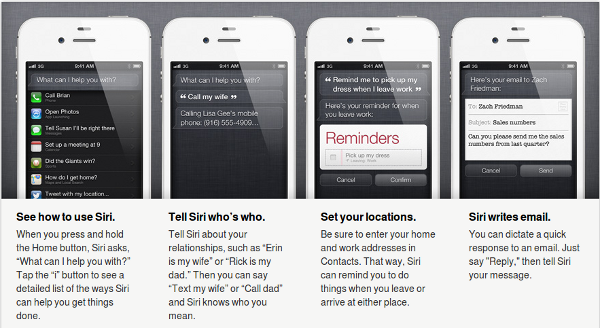 Demos as software, hardware and connections allow.
1) Real 3D without glasses, the Sony Bloggie 3D camera
2) Real 3D without glasses, the Nintendo 3DS game,
wi-fi web browser, tablet, ...
3) USB Touch Screen Monitor for use alone or as
a second touch screen display. Comes with very
small stylus for detail selection.
4) iPhone iSSH anywhere interface to linux.gl.umbc.edu
5) iPad tablet with iSSH anywhere interface to
linux.gl.umbc.edu
Demos as software, hardware and connections allow.
1) Real 3D without glasses, the Sony Bloggie 3D camera
2) Real 3D without glasses, the Nintendo 3DS game,
wi-fi web browser, tablet, ...
3) USB Touch Screen Monitor for use alone or as
a second touch screen display. Comes with very
small stylus for detail selection.
4) iPhone iSSH anywhere interface to linux.gl.umbc.edu
5) iPad tablet with iSSH anywhere interface to
linux.gl.umbc.edu
The Java 3D code SphereMotion.java
keeps moving. Yet, it can be captured, as seen by the file
SphereMotion.jpg
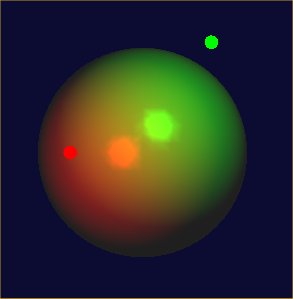 Note that the red and green dots are not planets but are the
position of the lights that are moving.
The method of capturing using external tools is operating system
dependent. There are many tools and methods for every operating
system, only one method is presented for each operating system.
On Microsoft Windows I make the window to be captured active by
clicking in the blue bar at the top of the window. Then I press
and hold the "alt" key while pressing and releasing the
"print scr" key. This captures the active window in the Microsoft
cut-and-paste buffer.
Now I execute PaintShopPro and click on the "edit" menu and drag
to "paste as new image" then release. At this point I may change
the size of the image or crop to a selected area or make other
modifications. To save the, possibly modified, image I use
"save as" and select the saved format, e.g. .jpg, .gif or other.
Then select the directory where the image is to be saved and
save the file.
On X Windows systems which include Unix, Linux and others,
I open a shell window and make it small in the lower right hand
corner of the screen. I "cd" to the directory where the file
containing the image is to be stored.
I then move the window to be captured to the upper left hand corner
of the screen so there is no overlap.
In the shell window I type "import name.jpg" and then left click
in the window to be captured. If sound is turned on there is one beep
when the capture starts and a second beep when capture is finished.
File types of at least .jpg, .png and .gif are recognized.
Then I do the cleanup: "gimp name.jpg" two windows come up,
one with tools, one with my captured image. I click on
dashed-square-box and place dashed line around the part
of the image I want. Then click on "image" menu and move
down to "crop to selection." Next, if I want a different
size, click on "image" menu and move down to "canvas size".
Now you can change horizontal and vertical size by
pixel or percentage. Be sure to use "file" then "save"
in order to keep you modifications.
The program "xv" can be used to display many image formats.
The command "xv name.jpg" will display the image captured by the
procedure above.
Your browser can display and print images.
Just use file:///home/your-directory/name.jpg
Or, file:///some-directory to see all the files, then navigate and
double click to view a graphics file.
On Microsoft Windows, file:///C:/documents and settings/user/name.jpg
Image file formats provide a range of compressions and thus a range
of sizes. The quality of the program writing the image file format
can also make a big difference. For example, to write a fully compressed
.gif file requires a license whereas a program can write a .gif file
that can be read by other applications and not use the proprietary
part of the compression.
Below is the same, large, image captured by "import" as .jpg, .png and
.gif. The sizes in bytes are respectively 39,098 , 11,490 and 329,115 .
These take a while to display, thus only the .jpg is shown:
The source code that you may get and put inside your application
includes:
www.ijg.org Independent Jpeg Group /files get jpegsrc.v6b.tar.gz
www.filelibrary.com/Contents/DOCS/101/new.html get jpeg6b.zip
libpng.sourceforge.net links to download
www.libpng.org/pub/png send you to sourceforge
Next: For the real GUI programmer, you want to build into your
application the ability to directly write out some image file
format. The code needed to capture the pixels from the screen
in your program depend on language and toolkit, not on operating
system. Thus, you can write portable code that outputs various
image file formats.
The following demonstrates basic capturing pixels, formatting and
writing the file. Modify to suit your needs. The examples cover
OpenGL, Java and X Windows. These happen to use the legal code
to do .gif output. Substitute .jpg, .png or other as you desire.
Note that the "decorations" put on by the window manager are not
part of your window. You only get out the pixels your application
writes.
w1gif.c w1.c with .gif output writes w1gif.gif
Note that the red and green dots are not planets but are the
position of the lights that are moving.
The method of capturing using external tools is operating system
dependent. There are many tools and methods for every operating
system, only one method is presented for each operating system.
On Microsoft Windows I make the window to be captured active by
clicking in the blue bar at the top of the window. Then I press
and hold the "alt" key while pressing and releasing the
"print scr" key. This captures the active window in the Microsoft
cut-and-paste buffer.
Now I execute PaintShopPro and click on the "edit" menu and drag
to "paste as new image" then release. At this point I may change
the size of the image or crop to a selected area or make other
modifications. To save the, possibly modified, image I use
"save as" and select the saved format, e.g. .jpg, .gif or other.
Then select the directory where the image is to be saved and
save the file.
On X Windows systems which include Unix, Linux and others,
I open a shell window and make it small in the lower right hand
corner of the screen. I "cd" to the directory where the file
containing the image is to be stored.
I then move the window to be captured to the upper left hand corner
of the screen so there is no overlap.
In the shell window I type "import name.jpg" and then left click
in the window to be captured. If sound is turned on there is one beep
when the capture starts and a second beep when capture is finished.
File types of at least .jpg, .png and .gif are recognized.
Then I do the cleanup: "gimp name.jpg" two windows come up,
one with tools, one with my captured image. I click on
dashed-square-box and place dashed line around the part
of the image I want. Then click on "image" menu and move
down to "crop to selection." Next, if I want a different
size, click on "image" menu and move down to "canvas size".
Now you can change horizontal and vertical size by
pixel or percentage. Be sure to use "file" then "save"
in order to keep you modifications.
The program "xv" can be used to display many image formats.
The command "xv name.jpg" will display the image captured by the
procedure above.
Your browser can display and print images.
Just use file:///home/your-directory/name.jpg
Or, file:///some-directory to see all the files, then navigate and
double click to view a graphics file.
On Microsoft Windows, file:///C:/documents and settings/user/name.jpg
Image file formats provide a range of compressions and thus a range
of sizes. The quality of the program writing the image file format
can also make a big difference. For example, to write a fully compressed
.gif file requires a license whereas a program can write a .gif file
that can be read by other applications and not use the proprietary
part of the compression.
Below is the same, large, image captured by "import" as .jpg, .png and
.gif. The sizes in bytes are respectively 39,098 , 11,490 and 329,115 .
These take a while to display, thus only the .jpg is shown:
The source code that you may get and put inside your application
includes:
www.ijg.org Independent Jpeg Group /files get jpegsrc.v6b.tar.gz
www.filelibrary.com/Contents/DOCS/101/new.html get jpeg6b.zip
libpng.sourceforge.net links to download
www.libpng.org/pub/png send you to sourceforge
Next: For the real GUI programmer, you want to build into your
application the ability to directly write out some image file
format. The code needed to capture the pixels from the screen
in your program depend on language and toolkit, not on operating
system. Thus, you can write portable code that outputs various
image file formats.
The following demonstrates basic capturing pixels, formatting and
writing the file. Modify to suit your needs. The examples cover
OpenGL, Java and X Windows. These happen to use the legal code
to do .gif output. Substitute .jpg, .png or other as you desire.
Note that the "decorations" put on by the window manager are not
part of your window. You only get out the pixels your application
writes.
w1gif.c w1.c with .gif output writes w1gif.gif
 Hex dump of the above file.
Note readable file type, GIF89a, width and height, little endian
hexadecimal 00C5 by 007A, mostly unused color table.
A color table is an indexed list of colors, e.g.
color
index R G B
0 255 0 0
1 0 255 0
2 0 0 255
3 200 200 200
Image byte values 0 0 1 3 2 2 2
would give pixels red, red, green, grey, blue, blue blue.
Note that in this simple case, only 256 colors are available for
any specific image. 8-bits replaces 24-bits for a 3-to-1 compression.
The image byte values may be further compressed by run length
encoding or other methods.
Ugh, this version does not build the color table, it basically tests
background, that will come out white, and other that will come out black.
w1glgif.c w1gl.c with .gif output writes w1glgif.gif
Hex dump of the above file.
Note readable file type, GIF89a, width and height, little endian
hexadecimal 00C5 by 007A, mostly unused color table.
A color table is an indexed list of colors, e.g.
color
index R G B
0 255 0 0
1 0 255 0
2 0 0 255
3 200 200 200
Image byte values 0 0 1 3 2 2 2
would give pixels red, red, green, grey, blue, blue blue.
Note that in this simple case, only 256 colors are available for
any specific image. 8-bits replaces 24-bits for a 3-to-1 compression.
The image byte values may be further compressed by run length
encoding or other methods.
Ugh, this version does not build the color table, it basically tests
background, that will come out white, and other that will come out black.
w1glgif.c w1gl.c with .gif output writes w1glgif.gif
 Hex dump of the above file.
color tables
Hex dump of the above file.
color tables
Some small special topics.
Review lectures 11 through 19 and homework 3.
With a few retro questions on previous lectures

Same type of quiz as Quiz 1.
Open book, open note, open computer.
       One hour time limit.
       (You may bring your own laptop)
       (Not the "Study Guide" or copies thereof.)
       (Read the instructions and follow the instructions.)
       (Read carefully, answer the question that is asked.)
Online : download
         edit with libreoffice or Microsoft Word
         submit quiz2

Key items:


3D rendering may use Z-plane or Ray Trace or other methods.
Povray is one free Ray Trace renderer. Ray casting does
a better job with shadows and transparent objects than
a Z plane renderer. When allowing the user to move
through a 3D image, the world stays stationary and it is
the users eye that moves through the world. For full
freedom, give the user six degrees of freedom.

Scroll Bars are typically used to "pan" across an image.
Typically scroll bars are on the bottom and right.
Some application allow a user to "zoom" in or out, larger or smaller.

In order to make movement realistic, use the equations
of physics. Usually provide some kind of manual or
automatic speed control, in order to account for various
computers having different processing and graphics speeds.

Typically users are given speed controls rather than
acceleration controls. The "accelerator" in a vehicle
is a speed control, in spite of its name. Some applications
may use a force control that is translated into an
acceleration using  Acceleration=Force/Mass.

Do not make users do things faster.
Do not make users change things such as fonts, mouse, or stylus.

Special purpose kinematics may be used in some applications
to compute a path from one location to another. These may
work in either two or three dimensions.

A body in air or space, has six degrees of freedom:
Movement in the three space dimensions, X, Y, Z and
rotation about the three axis through the center of
gravity, roll about the longitudinal axis, pitch about
the lateral axis and yaw about the vertical axis.

Target motion can be generated by using published
equation for curves and surfaces. A vapor trail can
be shown by keeping a few previous coordinates and
drawing increasingly smaller stuff.

Cartoons use squash and stretch and squeeze for humorous
effects. Older 2D cartoons used a hand drawn background
and moved only a mouth or hand for some frames. Each
frame became a frame on the final film. Each frame was
drawn by hand, called "ink and paint". Cartoon characters
do not have to obey the laws of physics.

Fonts are based on a point being 1/72 inch on paper.
Times Roman proportional, Currier fixed spacing.
Word processors can use any font files they can
find on your computer in a format they can read.
Free tools are available for you to create your
own font. Typically fonts are copyrighted because
they required a lot of work to create.

Questions about differences in user interface
for various platforms:
Desktop, Laptop, tablet, smart phone, game console.
Based on Lectures 11 through 19.
Based on all completed homework.

online:
On linux.gl in class download directory:
last name a-j a,  last name k-r b,  last name s-z c   ?

cp /afs/umbc.edu/users/s/q/squire/pub/download/q2_f21a.doc .
cp /afs/umbc.edu/users/s/q/squire/pub/download/q2_f21b.doc .
cp /afs/umbc.edu/users/s/q/squire/pub/download/q2_f21c.doc .

edit with libreoffice or Microsoft Word
submit quiz2 q2_f21?.doc  or q2_f21?.docx

See Lecture 19, Review 2 for more information
To start, perspective Viewing, Resize Choices and Transformation Matrices.
This lecture reviews the technical details and mathematics that
makes a 2D screen look like a 3D scene.
We then move do displaying 4D, 5D and 6D on a 2D screen.
Think matematics, not physics, 4, 5 or 6 independent variables
with one dependent value are 4D, 5D, 6D.
In the simplest case, computing the i,j screen position of
a vertex at world coordinates x,y,z is accomplished by
multiplying a 4 by 4 perspective matrix by a 4 by 4 model matrix
times the x,y,z,w vertex vector, then placing the i,j in
the viewport.
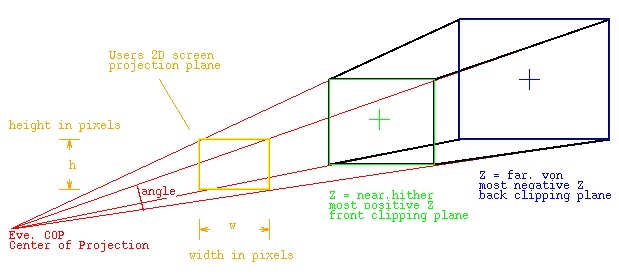 Shows the frustum that contains the 3D "World" that is to be
presented to the user. Any objects with more positive Z than "near"
are clipped, any objects with more negative values of Z than "far"
are clipped. Any objects outside of the X or Y of the frustum
are clipped. The positive Z axis is considered to come
out of the screen toward the viewer.
Name the vertices on the diagram as:
On the 'near' rectangle, the lower left is 'xmin' 'ymin'
the upper left is 'xmin' 'ymax'
the lower right is 'xmax' 'ymin'
the upper right is 'xmax' 'ymax'
The distance from the eye to near is 'near' a positive number
The distance from the eye to far is 'far' a positive number
The 4 by 4 perspective matrix is
|2*near/(xmax-xmin) 0.0 (xmax+xmin)/(xmax-xmin) 0.0 |
| |
| 0.0 2*near/(ymax-ymin) (ymax+ymin)/(ymax-ymin) 0.0 |
| |
| 0.0 0.0 -(far+near)/(far-near) -2*far*near/(far-near)|
| |
| 0.0 0.0 -1.0 0.0 |
The OpenGL call to create this perspective matrix is:
glFrustum(xmin, xmax, ymin, ymax, near, far);
An alternate call uses the vertical the eye position, looking at
the center of interest, + on 'far', and Y up=1, X up=0, Z up=0 is:
gluLookAt(eyex, eyey, eyez, coix, coiy, coiz, Xup, Yup, Zup);
Yet another alternative using the angle, field of view, and
w/h aspect ratio is:
gluPerspective(angle, w/h, near, far);
The model view matrix begins as the identity matrix and is multiplied
by the users rotations, scaling and translations. The world coordinates
may be in any system of physical units, yet all coordinates must
be in the same units. The six degrees of freedom for a solid 3D object
are to to translate in three dimensions and rotate about three axis.
The translation matrix to translate 0,0,0 to x,y,z is
| 1.0 0.0 0.0 x |
| 0.0 1.0 0.0 y | unused translations are 0.0
| 0.0 0.0 1.0 z |
| 0.0 0.0 0.0 1.0 |
glTranslatef(x, y, z);
The scaling matrix to scale x by sx, y by sy and z by sz is
| sx 0.0 0.0 0.0 |
| 0.0 sy 0.0 0.0 | unused scales are 1.0
| 0.0 0.0 sz 0.0 |
| 0.0 0.0 0.0 1.0 |
glScalef(sx, sy, sz);
The rotation matrix by angle a about the X axis is
| 1.0 0.0 0.0 0.0 |
| 0.0 cos a -sin a 0.0 |
| 0.0 sin a cos a 0.0 |
| 0.0 0.0 0.0 1.0 |
glRotatef(a, 1.0, 0.0, 0.0);
The rotation matrix by angle a about the Y axis is
| cos a 0.0 sin a 0.0 |
| 0.0 1.0 0.0 0.0 |
| -sin a 0.0 cos a 0.0 |
| 0.0 0.0 0.0 1.0 |
glRotatef(a, 0.0, 1.0, 0.0);
The rotation matrix by angle a about the Z axis is
| cos a -sin a 0.0 0.0 |
| sin a cos a 0.0 0.0 |
| 0.0 0.0 1.0 0.0 |
| 0.0 0.0 0.0 1.0 |
glRotatef(a, 0.0, 0.0, 1.0);
A user world coordinate vertex p = x, y, z, w (w=1.0)
is transformed into pp by
perspective matrix times model view matrix times p is pp
To get screen coordinates, given the screen width w, and
screen height h,
screen x = w * ((pp.x/pp.z)-xmin)/(xmax-xmin)
screen y = h * ((pp.y/pp.z)-ymin)/(ymax-ymin)
Trying to check that the equations are correct,
the program demo_mat.c writes out OpenGL matrices.
The output is demo_mat.out
The equations are coded in check_mat.c
The output is check_mat.out
It seems that OpenGL stores the matrix column major (Fortran style)
while the "C" program stores the matrix row major, causing the
printout to appear to be the transpose.
Row Major, first row first: C, Java, Python
{[0][0], [0][1], [0][2], [1][0], [1][1], [1][2], [2][0], [2][1], [2][2]}
Column Major, first column first: Fortran, Matlab
((1,1),(2,1),(3,1), (1,2),(2,2),(3,2), (1,3),(2,3),(3,3))
The same geometry and same data were used in both programs.
The final result from both is essentially the same.
output from demo_mat.c OpenGL
0.5, 1.5, 2.5 at win x=25.798641, y=345.927915, z=0.827098
output from check_mat.c
x scr, y scr=25.798841, 345.927778 at relative z=0.827098)
width, height =300.000000, 400.000000
In OpenGL or equivalently in your code, you can save the present matrix
and start with a new identity matrix, do transformations, cause actions,
then revert back the the prior matrix.
glPushMatrix();
glLoadIdentity();
glRotatef(theta[0], 1.0, 0.0, 0.0);
glRotatef(theta[1], 0.0, 1.0, 0.0);
glRotatef(theta[2], 0.0, 0.0, 1.0);
glTranslatef(pos[0], pos[1], pos[2]);
/* use the Model view matrix to do something */
glPopMatrix();
/* a possible Reshape, it happens on first expose and every change */
glViewport(0, 0, w, h);
glMatrixMode(GL_PROJECTION);
glLoadIdentity();
if(w <= h) /* e.g size = 2.0, x in -2.0 .. 2.0 */
glOrtho(-size, size, /* xmin, xmax */
-size*(GLfloat)h/(GLfloat)w, size*(GLfloat)h/(GLfloat)w,
/* ymin, ymax */
-10.0, 10.0); /* near in real Z value, far as real Z value */
else
glOrtho(-size*(GLfloat)w/(GLfloat)h, size*(GLfloat)w/(GLfloat)h,
-size, size, /* Y is size, w/h for X */
-10.0, 10.0);
glMatrixMode(GL_MODELVIEW);
glLoadIdentity();
/* go do Display or something */
Shows the frustum that contains the 3D "World" that is to be
presented to the user. Any objects with more positive Z than "near"
are clipped, any objects with more negative values of Z than "far"
are clipped. Any objects outside of the X or Y of the frustum
are clipped. The positive Z axis is considered to come
out of the screen toward the viewer.
Name the vertices on the diagram as:
On the 'near' rectangle, the lower left is 'xmin' 'ymin'
the upper left is 'xmin' 'ymax'
the lower right is 'xmax' 'ymin'
the upper right is 'xmax' 'ymax'
The distance from the eye to near is 'near' a positive number
The distance from the eye to far is 'far' a positive number
The 4 by 4 perspective matrix is
|2*near/(xmax-xmin) 0.0 (xmax+xmin)/(xmax-xmin) 0.0 |
| |
| 0.0 2*near/(ymax-ymin) (ymax+ymin)/(ymax-ymin) 0.0 |
| |
| 0.0 0.0 -(far+near)/(far-near) -2*far*near/(far-near)|
| |
| 0.0 0.0 -1.0 0.0 |
The OpenGL call to create this perspective matrix is:
glFrustum(xmin, xmax, ymin, ymax, near, far);
An alternate call uses the vertical the eye position, looking at
the center of interest, + on 'far', and Y up=1, X up=0, Z up=0 is:
gluLookAt(eyex, eyey, eyez, coix, coiy, coiz, Xup, Yup, Zup);
Yet another alternative using the angle, field of view, and
w/h aspect ratio is:
gluPerspective(angle, w/h, near, far);
The model view matrix begins as the identity matrix and is multiplied
by the users rotations, scaling and translations. The world coordinates
may be in any system of physical units, yet all coordinates must
be in the same units. The six degrees of freedom for a solid 3D object
are to to translate in three dimensions and rotate about three axis.
The translation matrix to translate 0,0,0 to x,y,z is
| 1.0 0.0 0.0 x |
| 0.0 1.0 0.0 y | unused translations are 0.0
| 0.0 0.0 1.0 z |
| 0.0 0.0 0.0 1.0 |
glTranslatef(x, y, z);
The scaling matrix to scale x by sx, y by sy and z by sz is
| sx 0.0 0.0 0.0 |
| 0.0 sy 0.0 0.0 | unused scales are 1.0
| 0.0 0.0 sz 0.0 |
| 0.0 0.0 0.0 1.0 |
glScalef(sx, sy, sz);
The rotation matrix by angle a about the X axis is
| 1.0 0.0 0.0 0.0 |
| 0.0 cos a -sin a 0.0 |
| 0.0 sin a cos a 0.0 |
| 0.0 0.0 0.0 1.0 |
glRotatef(a, 1.0, 0.0, 0.0);
The rotation matrix by angle a about the Y axis is
| cos a 0.0 sin a 0.0 |
| 0.0 1.0 0.0 0.0 |
| -sin a 0.0 cos a 0.0 |
| 0.0 0.0 0.0 1.0 |
glRotatef(a, 0.0, 1.0, 0.0);
The rotation matrix by angle a about the Z axis is
| cos a -sin a 0.0 0.0 |
| sin a cos a 0.0 0.0 |
| 0.0 0.0 1.0 0.0 |
| 0.0 0.0 0.0 1.0 |
glRotatef(a, 0.0, 0.0, 1.0);
A user world coordinate vertex p = x, y, z, w (w=1.0)
is transformed into pp by
perspective matrix times model view matrix times p is pp
To get screen coordinates, given the screen width w, and
screen height h,
screen x = w * ((pp.x/pp.z)-xmin)/(xmax-xmin)
screen y = h * ((pp.y/pp.z)-ymin)/(ymax-ymin)
Trying to check that the equations are correct,
the program demo_mat.c writes out OpenGL matrices.
The output is demo_mat.out
The equations are coded in check_mat.c
The output is check_mat.out
It seems that OpenGL stores the matrix column major (Fortran style)
while the "C" program stores the matrix row major, causing the
printout to appear to be the transpose.
Row Major, first row first: C, Java, Python
{[0][0], [0][1], [0][2], [1][0], [1][1], [1][2], [2][0], [2][1], [2][2]}
Column Major, first column first: Fortran, Matlab
((1,1),(2,1),(3,1), (1,2),(2,2),(3,2), (1,3),(2,3),(3,3))
The same geometry and same data were used in both programs.
The final result from both is essentially the same.
output from demo_mat.c OpenGL
0.5, 1.5, 2.5 at win x=25.798641, y=345.927915, z=0.827098
output from check_mat.c
x scr, y scr=25.798841, 345.927778 at relative z=0.827098)
width, height =300.000000, 400.000000
In OpenGL or equivalently in your code, you can save the present matrix
and start with a new identity matrix, do transformations, cause actions,
then revert back the the prior matrix.
glPushMatrix();
glLoadIdentity();
glRotatef(theta[0], 1.0, 0.0, 0.0);
glRotatef(theta[1], 0.0, 1.0, 0.0);
glRotatef(theta[2], 0.0, 0.0, 1.0);
glTranslatef(pos[0], pos[1], pos[2]);
/* use the Model view matrix to do something */
glPopMatrix();
/* a possible Reshape, it happens on first expose and every change */
glViewport(0, 0, w, h);
glMatrixMode(GL_PROJECTION);
glLoadIdentity();
if(w <= h) /* e.g size = 2.0, x in -2.0 .. 2.0 */
glOrtho(-size, size, /* xmin, xmax */
-size*(GLfloat)h/(GLfloat)w, size*(GLfloat)h/(GLfloat)w,
/* ymin, ymax */
-10.0, 10.0); /* near in real Z value, far as real Z value */
else
glOrtho(-size*(GLfloat)w/(GLfloat)h, size*(GLfloat)w/(GLfloat)h,
-size, size, /* Y is size, w/h for X */
-10.0, 10.0);
glMatrixMode(GL_MODELVIEW);
glLoadIdentity();
/* go do Display or something */
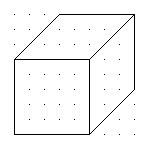 The simplest equations for orthographic projection are given by:
Xs, Ys are 2D screen coordinates. Assume 0,0 at lower left.
X,Y,Z are 3D world coordinates. Assume 0,0,0 at lower left.
Xs = X + cos(theta)*Z
Ys = Y + sin(theta)*Z
Scaling and offsets may be provided as required.
Theta is the angle up from the Xp axis to the where the 3D Z axis is drawn
Doing your own 3D projection may be easiest as orthographic.
For example, in this simple 3D shape entry program, the entry is
in XY (front view), XZ (top view), or YZ (side view) plane then
shown in three views and as orthographic.
The source is draw3D3.java
with output:
A first cut at 4D, four dimensional rendering, uses 5 by 5 matrices:
Note that there are now eight (8) degrees of freedom:
Move in X, Y, Z, T and rotations about each axis (split into 6 matrices)
The simplest equations for orthographic projection are given by:
Xs, Ys are 2D screen coordinates. Assume 0,0 at lower left.
X,Y,Z are 3D world coordinates. Assume 0,0,0 at lower left.
Xs = X + cos(theta)*Z
Ys = Y + sin(theta)*Z
Scaling and offsets may be provided as required.
Theta is the angle up from the Xp axis to the where the 3D Z axis is drawn
Doing your own 3D projection may be easiest as orthographic.
For example, in this simple 3D shape entry program, the entry is
in XY (front view), XZ (top view), or YZ (side view) plane then
shown in three views and as orthographic.
The source is draw3D3.java
with output:
A first cut at 4D, four dimensional rendering, uses 5 by 5 matrices:
Note that there are now eight (8) degrees of freedom:
Move in X, Y, Z, T and rotations about each axis (split into 6 matrices)
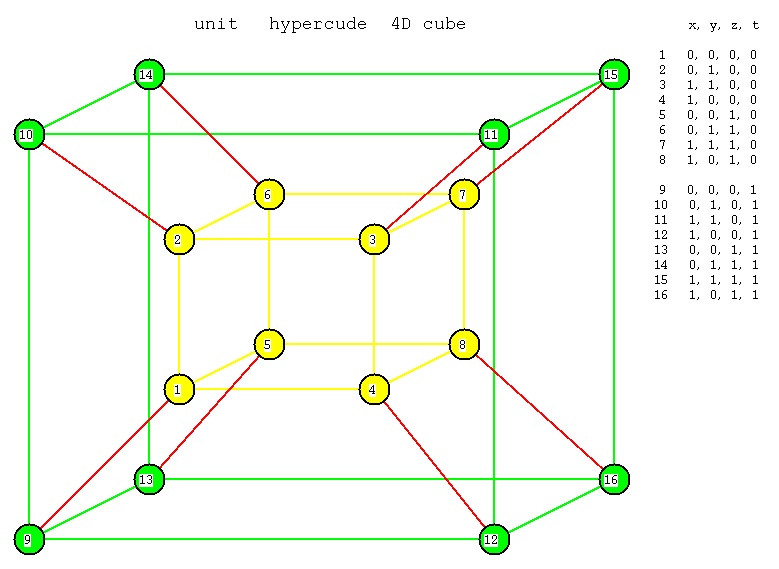 Notation: x is left and right.
y is up and down
z is forward and back
t is in and out (a fourth spacial dimension)
The 8 "3D faces" are:
1 2 3 4 5 6 7 8 inside
1 2 3 4 9 10 11 12 front
1 2 6 5 9 10 14 13 left
1 4 8 5 9 12 16 13 bottom
2 3 7 6 10 11 15 14 top
3 4 7 8 11 12 16 15 right
5 6 7 8 13 14 15 16 back
9 10 11 12 13 14 15 16 outside
as a check, every vertex must appear on exactly 8 faces.
There are 24 "2D faces" shown in cube.dat4
cube.dat4 unit hypercube data
The 5 by 5 perspective matrix is
|2*near 0.0 0.0 xmax+xmin 0.0 |
|--------- --------- |
|xmax-xmin xmax-xmin |
| |
| 0.0 2*near 0.0 ymax+ymin 0.0 |
| -------- --------- |
| ymax-ymin ymax-ymin |
| |
| 0.0 0.0 2*near zmax+zmin 0.0 |
| ------- ----------- |
| zmax-zmin zmax-zmin |
| |
| 0.0 0.0 0.0 -(far+near) -2*far*near |
| ----------- ----------- |
| far-near far-near |
| |
| 0.0 0.0 0.0 -1.0 0.0 |
The model view matrix is the product of the needed matrices below.
The translation matrix to translate 0,0,0,0 to x,y,z,t is
| 1.0 0.0 0.0 0.0 x |
| 0.0 1.0 0.0 0.0 y | unused translations are 0.0
| 0.0 0.0 1.0 0.0 z |
| 0.0 0.0 0.0 1.0 t |
| 0.0 0.0 0.0 0.0 1.0 |
translate(x, y, z, t)
The scaling matrix to scale x by sx, y by sy, z by sz, t by st is
| sx 0.0 0.0 0.0 0.0 |
| 0.0 sy 0.0 0.0 0.0 | unused scales are 1.0
| 0.0 0.0 sz 0.0 0.0 |
| 0.0 0.0 0.0 st 0.0 |
| 0.0 0.0 0.0 0.0 1.0 |
scale(sx, sy, sz, st)
The six rotation matrices are combined to make the four rotations:
The rotation matrix by angle a about the X,T axis is
| 1.0 0.0 0.0 0.0 0.0 |
| 0.0 cos a -sin a 0.0 0.0 |
| 0.0 sin a cos a 0.0 0.0 |
| 0.0 0.0 0.0 1.0 0.0 |
| 0.0 0.0 0.0 0.0 1.0 |
rotate(a, 1.0, 0.0, 0.0, 1.0)
The rotation matrix by angle a about the Y,T axis is
| cos a 0.0 -sin a 0.0 0.0 |
| 0.0 1.0 0.0 0.0 0.0 |
| sin a 0.0 cos a 0.0 0.0 |
| 0.0 0.0 0.0 1.0 0.0 |
| 0.0 0.0 0.0 0.0 1.0 |
rotate(a, 0.0, 1.0, 0.0, 1.0)
The rotation matrix by angle a about the Z,T axis is
| cos a -sin a 0.0 0.0 0.0 |
| sin a cos a 0.0 0.0 0.0 |
| 0.0 0.0 1.0 0.0 0.0 |
| 0.0 0.0 0.0 1.0 0.0 |
| 0.0 0.0 0.0 0.0 1.0 |
rotate(a, 0.0, 0.0, 1.0, 1.0)
The rotation matrix by angle a about the X,Y axis is
| 1.0 0.0 0.0 0.0 0.0 |
| 0.0 1.0 0.0 0.0 0.0 |
| 0.0 0.0 cos a -sin a 0.0 |
| 0.0 0.0 sin a cos a 0.0 |
| 0.0 0.0 0.0 0.0 1.0 |
rotate(a, 1.0, 1.0, 0.0, 0.0)
The rotation matrix by angle a about the X,Z axis is
| 1.0 0.0 0.0 0.0 0.0 |
| 0.0 cos a 0.0 -sin a 0.0 |
| 0.0 0.0 1.0 0.0 0.0 |
| 0.0 sin a 0.0 cos a 0.0 |
| 0.0 0.0 0.0 0.0 1.0 |
rotate(a, 1.0, 0.0, 1.0, 0.0)
The rotation matrix by angle a about the Y,Z axis is
| cos a 0.0 0.0 -sin a 0.0 |
| 0.0 1.0 0.0 0.0 0.0 |
| 0.0 0.0 1.0 0.0 0.0 |
| sin a 0.0 0.0 cos a 0.0 |
| 0.0 0.0 0.0 0.0 1.0 |
rotate(a, 0.0, 1.0, 1.0, 0.0)
To get a rotation about only the X axis,
use the matrix product of X,Y X,Z X,T
To get a rotation about only the Y axis,
use the matrix product of X,Y Y,Z Y,T
To get a rotation about only the Z axis,
use the matrix product of X,Z Y,Z Z,T
To get a rotation about only the T axis,
use the matrix product of X,T Y,T Z,T
A user world coordinate vertex p = x, y, z, t, w (w=1.0)
is transformed into pp by
perspective matrix times model view matrix times p is pp
To get screen coordinates, given the screen width w, and
screen height h,
screen x = w * ((pp.x/pp.t)-xmin)/(xmax-xmin) ?
screen y = h * ((pp.y/pp.t)-ymin)/(ymax-ymin) ?
Notation: x is left and right.
y is up and down
z is forward and back
t is in and out (a fourth spacial dimension)
The 8 "3D faces" are:
1 2 3 4 5 6 7 8 inside
1 2 3 4 9 10 11 12 front
1 2 6 5 9 10 14 13 left
1 4 8 5 9 12 16 13 bottom
2 3 7 6 10 11 15 14 top
3 4 7 8 11 12 16 15 right
5 6 7 8 13 14 15 16 back
9 10 11 12 13 14 15 16 outside
as a check, every vertex must appear on exactly 8 faces.
There are 24 "2D faces" shown in cube.dat4
cube.dat4 unit hypercube data
The 5 by 5 perspective matrix is
|2*near 0.0 0.0 xmax+xmin 0.0 |
|--------- --------- |
|xmax-xmin xmax-xmin |
| |
| 0.0 2*near 0.0 ymax+ymin 0.0 |
| -------- --------- |
| ymax-ymin ymax-ymin |
| |
| 0.0 0.0 2*near zmax+zmin 0.0 |
| ------- ----------- |
| zmax-zmin zmax-zmin |
| |
| 0.0 0.0 0.0 -(far+near) -2*far*near |
| ----------- ----------- |
| far-near far-near |
| |
| 0.0 0.0 0.0 -1.0 0.0 |
The model view matrix is the product of the needed matrices below.
The translation matrix to translate 0,0,0,0 to x,y,z,t is
| 1.0 0.0 0.0 0.0 x |
| 0.0 1.0 0.0 0.0 y | unused translations are 0.0
| 0.0 0.0 1.0 0.0 z |
| 0.0 0.0 0.0 1.0 t |
| 0.0 0.0 0.0 0.0 1.0 |
translate(x, y, z, t)
The scaling matrix to scale x by sx, y by sy, z by sz, t by st is
| sx 0.0 0.0 0.0 0.0 |
| 0.0 sy 0.0 0.0 0.0 | unused scales are 1.0
| 0.0 0.0 sz 0.0 0.0 |
| 0.0 0.0 0.0 st 0.0 |
| 0.0 0.0 0.0 0.0 1.0 |
scale(sx, sy, sz, st)
The six rotation matrices are combined to make the four rotations:
The rotation matrix by angle a about the X,T axis is
| 1.0 0.0 0.0 0.0 0.0 |
| 0.0 cos a -sin a 0.0 0.0 |
| 0.0 sin a cos a 0.0 0.0 |
| 0.0 0.0 0.0 1.0 0.0 |
| 0.0 0.0 0.0 0.0 1.0 |
rotate(a, 1.0, 0.0, 0.0, 1.0)
The rotation matrix by angle a about the Y,T axis is
| cos a 0.0 -sin a 0.0 0.0 |
| 0.0 1.0 0.0 0.0 0.0 |
| sin a 0.0 cos a 0.0 0.0 |
| 0.0 0.0 0.0 1.0 0.0 |
| 0.0 0.0 0.0 0.0 1.0 |
rotate(a, 0.0, 1.0, 0.0, 1.0)
The rotation matrix by angle a about the Z,T axis is
| cos a -sin a 0.0 0.0 0.0 |
| sin a cos a 0.0 0.0 0.0 |
| 0.0 0.0 1.0 0.0 0.0 |
| 0.0 0.0 0.0 1.0 0.0 |
| 0.0 0.0 0.0 0.0 1.0 |
rotate(a, 0.0, 0.0, 1.0, 1.0)
The rotation matrix by angle a about the X,Y axis is
| 1.0 0.0 0.0 0.0 0.0 |
| 0.0 1.0 0.0 0.0 0.0 |
| 0.0 0.0 cos a -sin a 0.0 |
| 0.0 0.0 sin a cos a 0.0 |
| 0.0 0.0 0.0 0.0 1.0 |
rotate(a, 1.0, 1.0, 0.0, 0.0)
The rotation matrix by angle a about the X,Z axis is
| 1.0 0.0 0.0 0.0 0.0 |
| 0.0 cos a 0.0 -sin a 0.0 |
| 0.0 0.0 1.0 0.0 0.0 |
| 0.0 sin a 0.0 cos a 0.0 |
| 0.0 0.0 0.0 0.0 1.0 |
rotate(a, 1.0, 0.0, 1.0, 0.0)
The rotation matrix by angle a about the Y,Z axis is
| cos a 0.0 0.0 -sin a 0.0 |
| 0.0 1.0 0.0 0.0 0.0 |
| 0.0 0.0 1.0 0.0 0.0 |
| sin a 0.0 0.0 cos a 0.0 |
| 0.0 0.0 0.0 0.0 1.0 |
rotate(a, 0.0, 1.0, 1.0, 0.0)
To get a rotation about only the X axis,
use the matrix product of X,Y X,Z X,T
To get a rotation about only the Y axis,
use the matrix product of X,Y Y,Z Y,T
To get a rotation about only the Z axis,
use the matrix product of X,Z Y,Z Z,T
To get a rotation about only the T axis,
use the matrix product of X,T Y,T Z,T
A user world coordinate vertex p = x, y, z, t, w (w=1.0)
is transformed into pp by
perspective matrix times model view matrix times p is pp
To get screen coordinates, given the screen width w, and
screen height h,
screen x = w * ((pp.x/pp.t)-xmin)/(xmax-xmin) ?
screen y = h * ((pp.y/pp.t)-ymin)/(ymax-ymin) ?
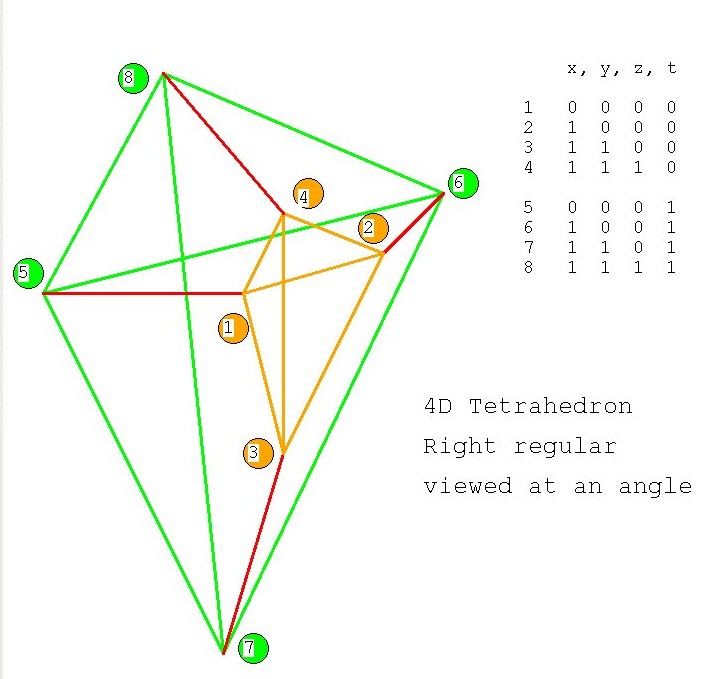 Notation: x is left and right.
y is up and down
z is forward and back
t is in and out (a fourth spacial dimension)
Vertices x, y, z, t
1 0, 0, 0, 0
2 1, 0, 0, 0
3 1, 1, 0, 0
4 1, 1, 1, 0
5 0, 0, 0, 1
6 1, 0, 0, 1
7 1, 1, 0, 1
8 1, 1, 1, 1
as a check, every vertex must appear on exactly 6 faces.
There are 14 "2D faces" shown in tetra.dat4
tetra.dat4 unit 4D Tetrahedron data
This is possible, yet really difficult, another approach is
to use a dynamic display and allow the user to select
the independent variables to be changed.
Notation: x is left and right.
y is up and down
z is forward and back
t is in and out (a fourth spacial dimension)
Vertices x, y, z, t
1 0, 0, 0, 0
2 1, 0, 0, 0
3 1, 1, 0, 0
4 1, 1, 1, 0
5 0, 0, 0, 1
6 1, 0, 0, 1
7 1, 1, 0, 1
8 1, 1, 1, 1
as a check, every vertex must appear on exactly 6 faces.
There are 14 "2D faces" shown in tetra.dat4
tetra.dat4 unit 4D Tetrahedron data
This is possible, yet really difficult, another approach is
to use a dynamic display and allow the user to select
the independent variables to be changed.
4D sphere
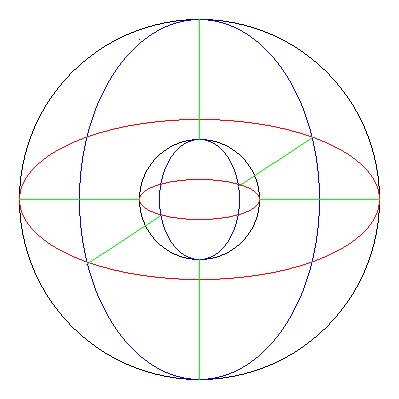 4th dimension smaller
User control for plotting any two of x, y, z, t
against the value of function u(x,y,z,t)
source code plot_4d.java
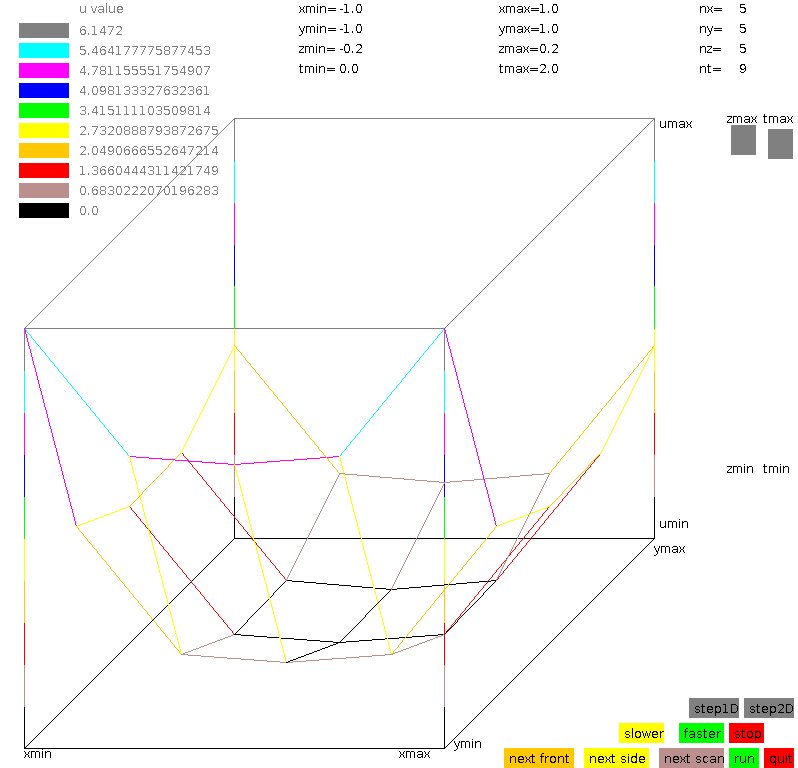 source code plot4d_gl.c
plot4d data generator f4d.c
source code plot4d_gl.c
plot4d data generator f4d.c
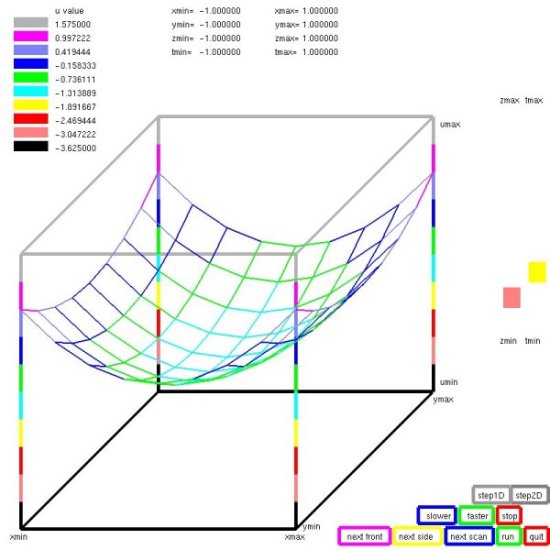 Front and side display can be any pair.
The right side shows the other two variables.
Step for looking at individual values,
"run" for moving display.
Front and side display can be any pair.
The right side shows the other two variables.
Step for looking at individual values,
"run" for moving display.
octrahedron in 3D and increased to 4D
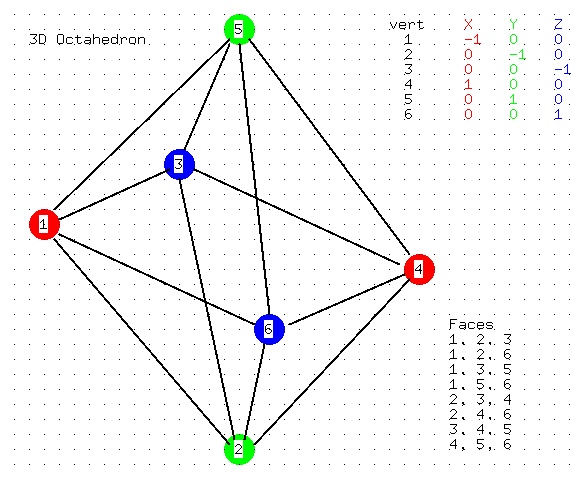
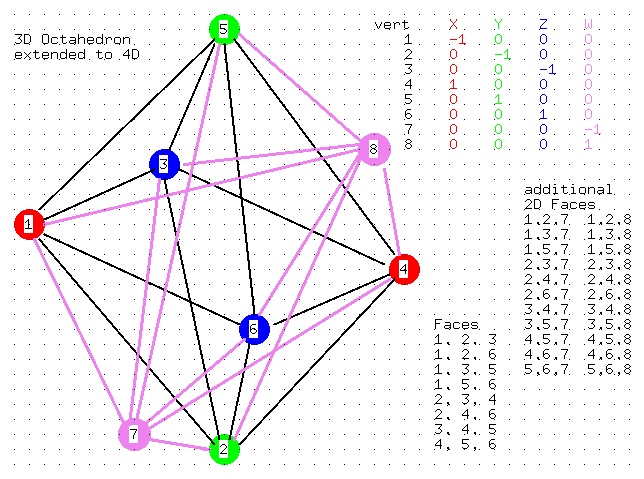
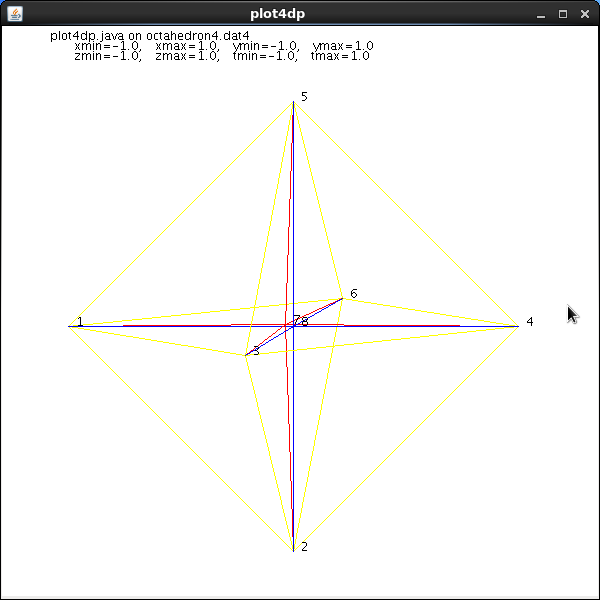
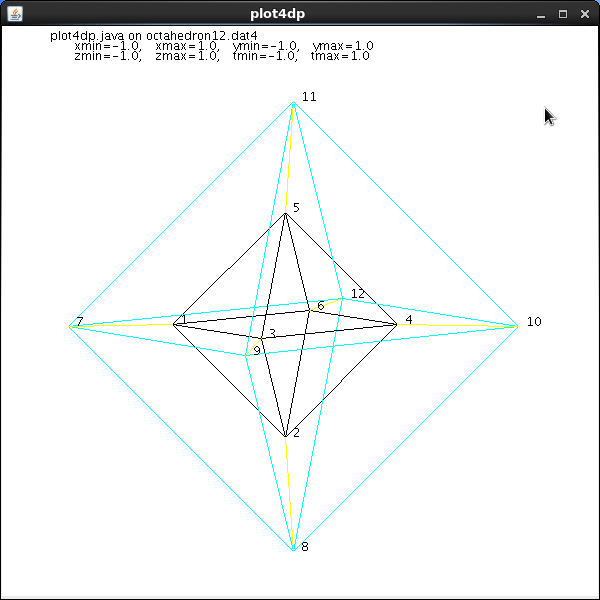 Data file for light_dat3
octahedron3.dat
Data file for plot4dp (java)
octahedron4.dat4
Data file for plot4dp (java)
octahedron12.dat4
source code plot4dp.java
Of course, this extends to 5D and 6D and 7D
source code plot5d_gl.c
source code plot6d_gl.c
source code plot7d_gl.c
source code plot5d.java
source code plot6d.java
source code plot7d.java
Data file for light_dat3
octahedron3.dat
Data file for plot4dp (java)
octahedron4.dat4
Data file for plot4dp (java)
octahedron12.dat4
source code plot4dp.java
Of course, this extends to 5D and 6D and 7D
source code plot5d_gl.c
source code plot6d_gl.c
source code plot7d_gl.c
source code plot5d.java
source code plot6d.java
source code plot7d.java
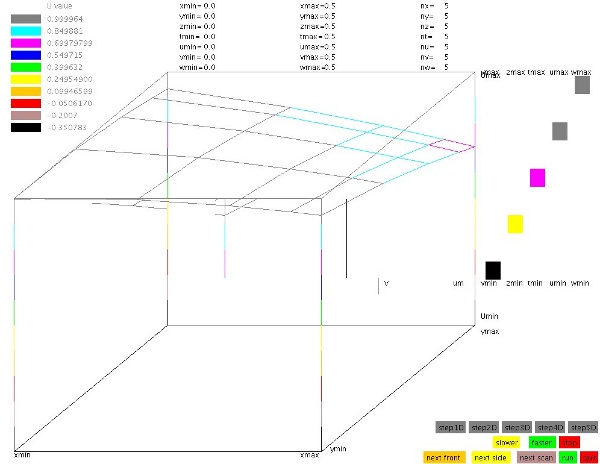
Some 5D data
5D cube data cube.dat5
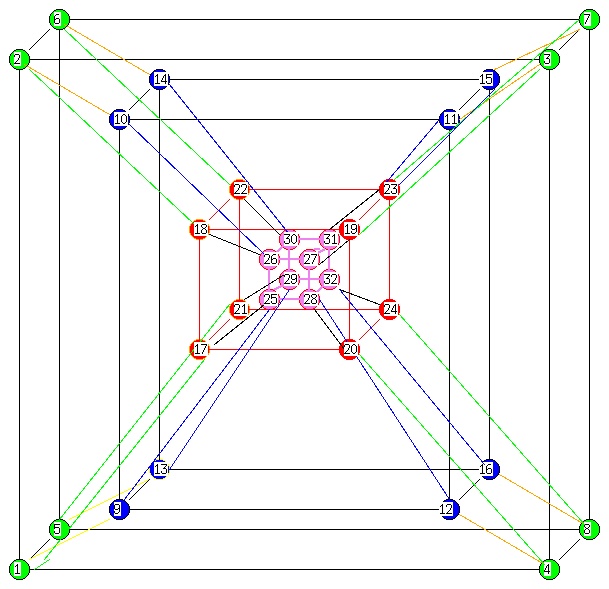
Cube and Sphere to higher dimensions
faces.c source
faces.out shown below
faces.c running, data for various n-cubes, n dimensions
0-cube point
vertices = 1
1-cube line
edges = 1
vertices = 2
2-cube square
2D faces = 1
edges = 4
vertices = 4
3-cube cube
cubes = 1
2D faces = 6
edges = 12
vertices = 8
n=4-cube
4-cubes = 1
cubes = 8
2D faces = 24
edges = 32
vertices = 16
n=5-cube
5-cubes = 1
4-cubes = 10
cubes = 40
2D faces = 80
edges = 80
vertices = 32
n=6-cube
6-cubes = 1
5-cubes = 12
4-cubes = 60
cubes = 160
2D faces = 240
edges = 192
vertices = 64
n=7-cube
7-cubes = 1
6-cubes = 14
5-cubes = 84
4-cubes = 280
cubes = 560
2D faces = 672
edges = 448
vertices = 128
n=8-cube
8-cubes = 1
7-cubes = 16
6-cubes = 112
5-cubes = 448
4-cubes = 1120
cubes = 1792
2D faces = 1792
edges = 1024
vertices = 256
D-1 surface D volume
2D circle 2 Pi R Pi R^2
3D sphere 4 Pi R^2 4/3 Pi R^3
4D 4-sphere 2 Pi^2 R^3 1/2 Pi^2 R^4
5D 5-sphere 8/3 Pi^2 R^4 8/15 Pi^2 R^5
6D 6-sphere Pi^3 R^5 1/6 Pi^3 R^6
7D 7-sphere 16/15 Pi^3 R^6 16/105 Pi^3 R^7
8D 8-sphere 1/3 Pi^4 R^7 1/24 Pi^4 R^8
9D 9-sphere 32/105 Pi^4 R^8 32/945 Pi^4 R^9
volume V_n(R)= Pi^(n/2) R^n / gamma(n/2+1)
gamma(integer) = factorial(integer-1) gamma(5) = 24
gamma(1/2) = sqrt(Pi), gamma(n/2+1) = (2n)! sqrt(Pi)/(4^n n!)
or V_2k(R) = Pi^k R^2k/k! , V_2k+1 = 2 k! (4Pi)^k R^(2k+1)/(2k+1)!
surface area A_n(R) = d/dR V_n(R)
10D 10-sphere volume 1/120 Pi^5 R^10
10D 10-sphere area 1/12 Pi^5 R^9
one definition of sequence of n-spheres
for n=8
a1, a2, a3, a4, a5, a6, a7 are angles, typ: theta, phi, ...
x1, x2, x3, x4, x5, x6, x7, x8 are orthogonal coordinates
x1^2 + x2^2 + x3^2 + x4^2 + x5^2 + x6^2 + x7^2 +x8^2 = R^2
Radius R = sqrt(R^2)
2D circle
x1 = R sin(a1) typ: y theta
x2 = R cos(a1) typ: x theta
a1 = arctan(x1/x2)
3D sphere
x1 = R sin(a2) sin(a1) typ: y phi theta
x2 = R sin(a2) cos(a1) typ: x phi theta
x3 = R cos(a2) typ: z phi
a1 = arctan(sqrt(x1^2+x2^2)/x3)
a2 = arctan(x1/x2)
4D 4-sphere
x1 = R sin(a3) sin(a2) sin(a1)
x2 = R sin(a3) sin(a2) cos(a1)
x3 = R sin(a3) cos(a2)
x4 = R cos(a3)
a1 = arctan(sqrt(x1^2+x2^2+x3^2)/x4)
a2 = arctan(sqrt(x1^2+x2^2)/x3)
a3 = arctan(x1/x2)
5D 5-sphere
x1 = R sin(a4) sin(a3) sin(a2) sin(a1)
x2 = R sin(a4) sin(a3) sin(a2) cos(a1)
x3 = R sin(a4) sin(a3) cos(a2)
x4 = R sin(a4) cos(a3)
x5 = R cos(a4)
6D 6-sphere
x1 = R sin(a5) sin(a4) sin(a3) sin(a2) sin(a1)
x2 = R sin(a5) sin(a4) sin(a3) sin(a2) cos(a1)
x3 = R sin(a5) sin(a4) sin(a3) cos(a2)
x4 = R sin(a5) sin(a4) cos(a3)
x5 = R sin(a5) cos(a4)
x6 = R cos(a5)
7D 7-sphere
x1 = R sin(a6) sin(a5) sin(a4) sin(a3) sin(a2) sin(a1)
x2 = R sin(a6) sin(a5) sin(a4) sin(a3) sin(a2) cos(a1)
x3 = R sin(a6) sin(a5) sin(a4) sin(a3) cos(a2)
x4 = R sin(a6) sin(a5) sin(a4) cos(a3)
x5 = R sin(a6) sin(a5) cos(a4)
x6 = R sin(a6) cos(a5)
x7 = R cos(a6)
8D 8-sphere
x1 = R sin(a7) sin(a6) sin(a5) sin(a4) sin(a3) sin(a2) sin(a1)
x2 = R sin(a7) sin(a6) sin(a5) sin(a4) sin(a3) sin(a2) cos(a1)
x3 = R sin(a7) sin(a6) sin(a5) sin(a4) sin(a3) cos(a2)
x4 = R sin(a7) sin(a6) sin(a5) sin(a4) cos(a3)
x5 = R sin(a7) sin(a6) sin(a5) cos(a4)
x6 = R sin(a7) sin(a6) cos(a5)
x7 = R sin(a7) cos(a6)
x8 = R cos(a7)
faces.c finished
If you have not seen it yet:
flatland clip
www.flatlandthemovie.com
Why did I choose to use triangles in Lecture 21,
3 point surface, rather than 4 point surface?
Answer: For efficiency and ease of coding for lighting.
There are many types of renderer's as covered in Lecture 18.
For this lecture I am focusing on a renderer that will use
Phong Specular Lighting and thus requires normals to surfaces
that are interpolated across the surface.
To understand relative efficiency, in this case twice as many
3 point surfaces as four point surfaces for the same object,
both the data structures and the processing must be analyzed.
The data structures, copied from working code, are:
typedef struct {GLfloat x; GLfloat y; GLfloat z;
GLfloat nx; GLfloat ny; GLfloat nz;} dpts;
static dpts * data_points; /* malloc'd space for vertices */
Note: x,y,z is a point, vertex, on a surface, nx,ny,nz is a vector
from that point in the direction of the outward normal to the surface.
For example, OpenGL code using normals and vertices:
glNormal3f(data_points[k-1].nx, data_points[k-1].ny, data_points[k-1].nz);
glVertex3f(data_points[k-1].x, data_points[k-1].y, data_points[k-1].z);
With precomputed normals from:
for(i=0; i<num_pts; i++)
{
/* get &data_points[i].x, &data_points[i].y, &data_points[i].z */
data_points[i].nx = 0.0; /* normals averaged and normalized */
data_points[i].ny = 0.0;
data_points[i].nz = 0.0;
}
/* pick up three points, pts, of a polygon */
/* v[0], v[1], v[2] three point triangle */
for(j=0; j<3; j++)
v[j] = data_points[kk[j]-1];
/* compute, normalize and average normals */
ax = v[2].x - v[1].x;
ay = v[2].y - v[1].y;
az = v[2].z - v[1].z;
bx = v[1].x - v[0].x;
by = v[1].y - v[0].y;
bz = v[1].z - v[0].z;
nx = ay*bz-az*by; /* cross product */
ny = az*bx-ax*bz;
nz = ax*by-ay*bx; /* technically, the normal at point [1] */
s = sqrt(nx*nx + ny*ny + nz*nz);
nx = nx / s; /* normalize to length = 1.0 */
ny = ny / s;
nz = nz / s;
for(j=0; j<j; j++)
{
data_points[kk[j]-1].nx += nx; /* sum normals */
data_points[kk[j]-1].ny += ny;
data_points[kk[j]-1].nz += nz;
}
for(j=3; j<pts; j++)
{
/* if more than 3 points, compute normal at every vertex */
/* repeat 13 lines above for points other than [1] */
}
I have provided the utility files to read, write and clean the
".dat" and binary form ".det" files that can be used with OpenGL
and other applications.
The basic capabilities are shown in datread.h
The code is in datread.c
Three sample uses that provide various OpenGL viewers for .dat files are
light_dat.c
light_dat2.c
light_dat3.c
light_dat.java
Some screen shots are
Now, suppose you want to edit a 3D image.
Possibly by picking a point and pulling it.
What can we give the used to help pick the points?
a) wireframe display with color change
b) vertex display with color change
c) trimmed vertex display with color change
d) color depths with various shades
Demonstrate light_dat3 skull.dat
w h to rotate, mouse to pick a vertex
note color change to show "pick"
v now vertices, mouse to pick
t trims vertices that should be hidden
less clutter
c (work in progress) show depth as various shades
Notice that a closed volume has an inside and an outside.
Most graphics software requires the normal vector to point outward.
An open volume may have a different color on the inside from the
color on the outside. Generally surfaces are given by triangles,
rectangles or polygons. The convention is to list the vertices
in counter clockwise order ( CCW ). The figure below is a cube
with the six surfaces flattened and the eight vertices labeled.
The order of the vertices allows the computation of the normal
to be an outgoing vector.
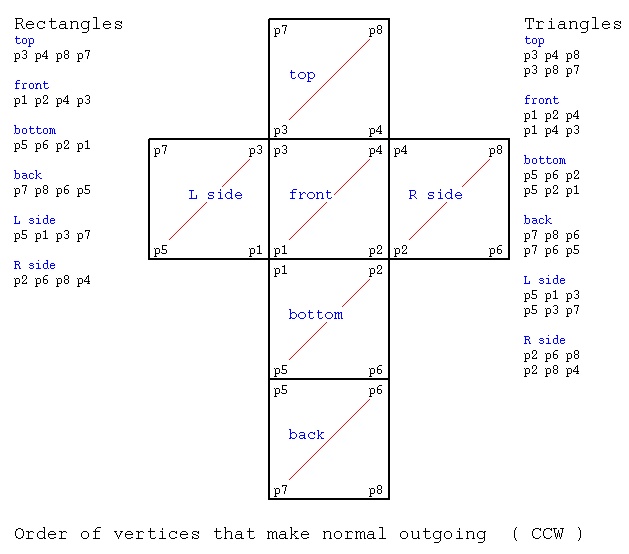 One specific format, the .dat (ASCII) or .det (binary) is:
number-of-vertices number-of-polygons
x1 y1 z1 three floating point numbers
x2 y2 z2
...
xn yn zn n = number of vertices
c1 vi vj vk ... vc1 vertex numbers starting with 1, c1 of them
c2 vl vn vm each line can have different number of points
...
cm va vb vc m = number-of-polygons
Example file acube.dat (annotation, not part of file)
8 6
0.0 0.0 0.0 p1
1.0 0.0 0.0 p2
0.0 1.0 0.0 p3
1.0 1.0 0.0 p4
0.0 0.0 1.0 p5
1.0 0.0 1.0 p6
0.0 1.0 1.0 p7
1.0 1.0 1.0 p8
4 3 4 8 7 top
4 1 2 4 3 front
4 5 6 2 1 bottom
4 7 8 6 5 back
4 5 1 3 7 L side
4 2 6 8 4 R side
A .stl ASCII file consists of triangles and the normals
with lots of labeling as in cube2.stl
We can convert binary .stl files to readable ASCII files using
stl_btoa.c
Examples are converting pot.stl to apot.stl and planter.stl to aplanter.stl.
binary pot.stl
readable apot.stl
binary planter.stl
readable aplanter.stl
Then we can translate binary .stl to Utah Graphics .dat and plot.
stl_to_dat.c
Examples are converting pot.stl to pot.dat and planter.stl to planter.dat.
readable pot.dat
readable planter.dat
One specific format, the .dat (ASCII) or .det (binary) is:
number-of-vertices number-of-polygons
x1 y1 z1 three floating point numbers
x2 y2 z2
...
xn yn zn n = number of vertices
c1 vi vj vk ... vc1 vertex numbers starting with 1, c1 of them
c2 vl vn vm each line can have different number of points
...
cm va vb vc m = number-of-polygons
Example file acube.dat (annotation, not part of file)
8 6
0.0 0.0 0.0 p1
1.0 0.0 0.0 p2
0.0 1.0 0.0 p3
1.0 1.0 0.0 p4
0.0 0.0 1.0 p5
1.0 0.0 1.0 p6
0.0 1.0 1.0 p7
1.0 1.0 1.0 p8
4 3 4 8 7 top
4 1 2 4 3 front
4 5 6 2 1 bottom
4 7 8 6 5 back
4 5 1 3 7 L side
4 2 6 8 4 R side
A .stl ASCII file consists of triangles and the normals
with lots of labeling as in cube2.stl
We can convert binary .stl files to readable ASCII files using
stl_btoa.c
Examples are converting pot.stl to apot.stl and planter.stl to aplanter.stl.
binary pot.stl
readable apot.stl
binary planter.stl
readable aplanter.stl
Then we can translate binary .stl to Utah Graphics .dat and plot.
stl_to_dat.c
Examples are converting pot.stl to pot.dat and planter.stl to planter.dat.
readable pot.dat
readable planter.dat
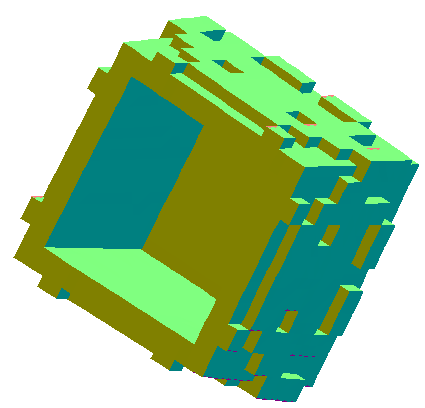 pot.png plotted with light_dat.java, trim with gimp
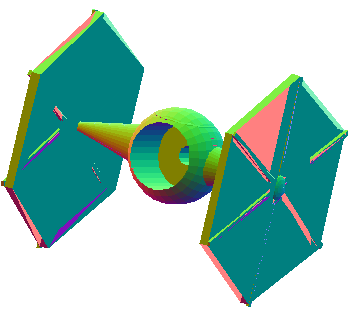 planter.png plotted with light_dat.java, trim with gimp
Note that most 3D printers are using .stl files to generate
3D objects.
3D printer uses
We can convert .dat files to .stl files
dat_to_stl.java
We can convert .stl files to .dat files
stl_to_dat.java
We can directly display 3D .stl files
light_stl.java
light_stl.py3
light_normal_stl.java
stl_scale.java change size
planter.png plotted with light_dat.java, trim with gimp
Note that most 3D printers are using .stl files to generate
3D objects.
3D printer uses
We can convert .dat files to .stl files
dat_to_stl.java
We can convert .stl files to .dat files
stl_to_dat.java
We can directly display 3D .stl files
light_stl.java
light_stl.py3
light_normal_stl.java
stl_scale.java change size
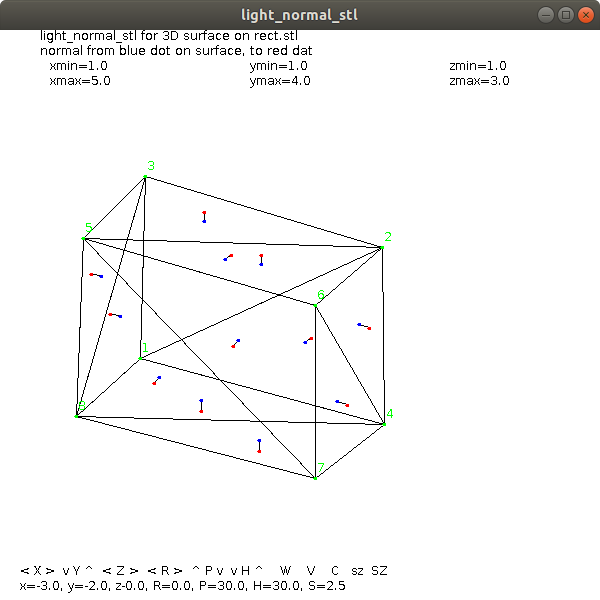 cube.stl
 coming soon 3D printer
Neither of the above files contain color information.
They just define the shape of an object.
A renderer takes a control file that places many objects and
applies color and shading to the objects. One such file is
lab6_input1 shown below:
device: lab6_input1.rle
postscript: lab6_input1.ps
debug: 1
viewport: 400 400
coi: 0 0 0
hither_yon: 1 100
observer: 4 1 20
angle: 8.0
light_position: 10 30 30
light_color: 1 1 1
object: drop.dat
color_type: 1 1 0 0
illumination_parameters: .2 .8 1.0 50
shading: phong
rotate: 45 30 60
scale: 1 1 1
translate: .25 -.36 0
object: drop.dat
color_type: 1 1 1 0
illumination_parameters: .25 .75 1.0 10
shading: phong
rotate: 0 0 180
scale: 1 1 1
translate: 0 .6 0
object: cube.dat
illumination_parameters: .3 .70 0.0 10
shading: phong
color_type: 1 1 .5 .5
scale: 2 2 .1
translate: 0 0 -.5
object: cube.dat
shading: phong
color_type: 1 .2 .9 1
illumination_parameters: .25 .75 1.0 100
scale: 2.0 .2 2.0
translate: 0 -1.0 .5
end
Note: shading, color, illumination, scale and position (translate)
are given for each object. Global parameters include window size,
center of interest, truncated prism specification, files, etc.
The result of the above scene is shown below.
coming soon 3D printer
Neither of the above files contain color information.
They just define the shape of an object.
A renderer takes a control file that places many objects and
applies color and shading to the objects. One such file is
lab6_input1 shown below:
device: lab6_input1.rle
postscript: lab6_input1.ps
debug: 1
viewport: 400 400
coi: 0 0 0
hither_yon: 1 100
observer: 4 1 20
angle: 8.0
light_position: 10 30 30
light_color: 1 1 1
object: drop.dat
color_type: 1 1 0 0
illumination_parameters: .2 .8 1.0 50
shading: phong
rotate: 45 30 60
scale: 1 1 1
translate: .25 -.36 0
object: drop.dat
color_type: 1 1 1 0
illumination_parameters: .25 .75 1.0 10
shading: phong
rotate: 0 0 180
scale: 1 1 1
translate: 0 .6 0
object: cube.dat
illumination_parameters: .3 .70 0.0 10
shading: phong
color_type: 1 1 .5 .5
scale: 2 2 .1
translate: 0 0 -.5
object: cube.dat
shading: phong
color_type: 1 .2 .9 1
illumination_parameters: .25 .75 1.0 100
scale: 2.0 .2 2.0
translate: 0 -1.0 .5
end
Note: shading, color, illumination, scale and position (translate)
are given for each object. Global parameters include window size,
center of interest, truncated prism specification, files, etc.
The result of the above scene is shown below.
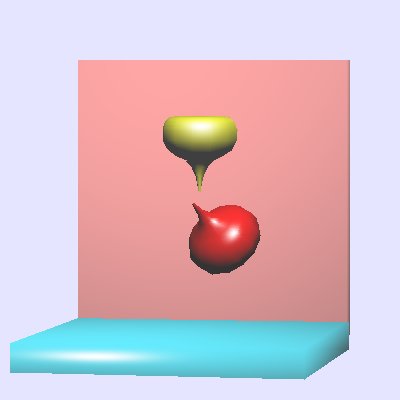 Many other file formats are avaiable, and ugh! used.
e.g. .nff is used by many raytrace programs
NFF file format
jon_1.nff
Many other file formats are avaiable, and ugh! used.
e.g. .nff is used by many raytrace programs
NFF file format
jon_1.nff
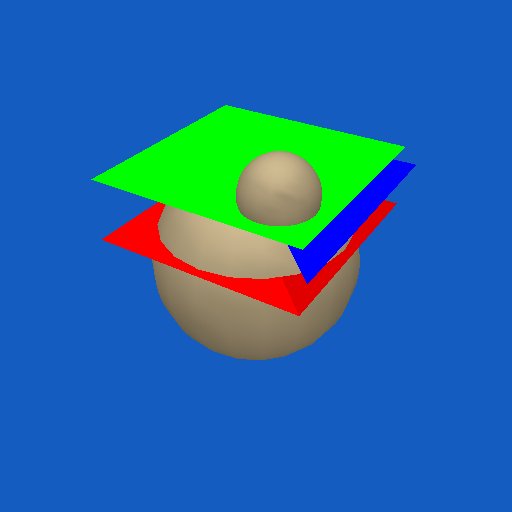 UMBC Game Track makes national news:
From: technews
Subject: ACM TechNews; Wednesday, April 23, 2008
Read the TechNews Online at: http://technews.acm.org
HEADLINES AT A GLANCE:
* Serious About Games
Serious About Games
Baltimore Sun (04/20/08) P. 1A; Emery, Chris
Nearly 400 U.S. colleges and universities, including MIT and Carnegie
Mellon, now offer formal training in game development, ranging from
elective courses to full degree programs. The increasing complexity
of computers and game systems requires teams of dozens of artists,
producers, and programmers to create a game. "Twenty years ago, a
game was made by one guy, or two or three people," says International
Game Developers Association executive director Jason Della Rocca.
"The games you see now take up to 200 people to make. You need a more
institutionalized pipeline of training developers." Vocational
schools have a lead in issuing certificates in game development, but
universities are catching up as more students demand full degree
programs.
The University of Maryland Baltimore County's program
provides broad-based training in visual arts and computer science.
UMBC computer science professor Marc Olano says the school's gaming
classes are designed to give students a solid education that will
make them employable outside of the game industry. However, there are
plenty of jobs for gaming majors. The average developer's salary was
$73,000 last year, according to Game Developer magazine, while
computer and video game sales have tripled since 1996. "Students are
demanding these types of programs, and schools are listening," Della
Rocca says. "These classes do well in terms of filling classrooms."
Click Here to View Full Article - Web Link May Require Free Registration
UMBC Game Track makes national news:
From: technews
Subject: ACM TechNews; Wednesday, April 23, 2008
Read the TechNews Online at: http://technews.acm.org
HEADLINES AT A GLANCE:
* Serious About Games
Serious About Games
Baltimore Sun (04/20/08) P. 1A; Emery, Chris
Nearly 400 U.S. colleges and universities, including MIT and Carnegie
Mellon, now offer formal training in game development, ranging from
elective courses to full degree programs. The increasing complexity
of computers and game systems requires teams of dozens of artists,
producers, and programmers to create a game. "Twenty years ago, a
game was made by one guy, or two or three people," says International
Game Developers Association executive director Jason Della Rocca.
"The games you see now take up to 200 people to make. You need a more
institutionalized pipeline of training developers." Vocational
schools have a lead in issuing certificates in game development, but
universities are catching up as more students demand full degree
programs.
The University of Maryland Baltimore County's program
provides broad-based training in visual arts and computer science.
UMBC computer science professor Marc Olano says the school's gaming
classes are designed to give students a solid education that will
make them employable outside of the game industry. However, there are
plenty of jobs for gaming majors. The average developer's salary was
$73,000 last year, according to Game Developer magazine, while
computer and video game sales have tripled since 1996. "Students are
demanding these types of programs, and schools are listening," Della
Rocca says. "These classes do well in terms of filling classrooms."
Click Here to View Full Article - Web Link May Require Free Registration
WOW! All this in one lecture?
Actually, this is a group of samples showing techniques
for using HTML5 canvas suplemented with some javascript
and some CSS. All three subjects are huge.
First, some dynamic display, just using HTML5 canvas and
some javascript, overdone, for a moving color wheel.
run canvas2.html
HTML5 canvas2.html