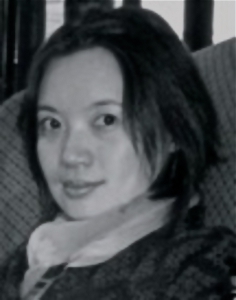
 New CSEE assistant professor Jian Chen creates visualizations to represent large data sets.
Few things are more daunting than an excel spreadsheet full of data. Even scientists can react to massive data sets with blank stares. That’s where the work of new CSEE assistant professor Jian Chen comes into play. As a designer of visualization and interaction techniques, Chen translates data into symbols that humans are good at interpreting.
“I have been working with biologists, physiologists, neurologists, cognitive scientists, and structural engineers to study cutting edge visualization science,” says Chen.
Take her work with bats. Chen has been helping biologists analyze bat flight kinematics among species. She looks at how their wings morph during flight, and expresses the information with colorful representations that are easier to grasp than numbers.
Chen’s most recent research grant supports a project that works on expressing massive biology datasets in a simple way. The method is called “PathBubbles.” This interactive pathway visualization tool displays gene products as dots, and the connections between those genes as lines. The color of those dots varies depending on importance, and different colored lines can suggest things like binding between gene products or the sharing of a small molecule.
When a user clicks on a particular dot, it opens up a database of information about each gene product and each interaction. Scientists can even add dots and lines to the database, as well as information about how the new genes should interact with genes already present in the database. With this new information, the system will be able to predict the effect of the newly-introduced gene product on the biological pathways.
Though PathBubbles is being developed to represent data from gene studies, its ability to graphically test different hypotheses has the potential to be applied to other fields like Chemistry, Engineering, Physics, and Computer Science.
For Chen, who says she was born to be a designer, creating visualizations is about allowing us to understand more, better, and faster. “It may lead to significantly better approaches to human knowledge discovery and decision making in many disciplines where visualizations have found successful application, including Neuroscience, Biomedicine, Bioinformatics, Biology, Chemistry, Geosciences, Business, Economics, and Education.”
Chen fell in love with visualizations as a Master’s student at Tsinghua University and Tianjin University in China, where she was working towards a Mechanical Engineering degree.
After that, Chen got her Master’s in Computer Science from the University of Houston, followed by her Ph.D. from Virginia Polytechnic Institute and State University. Her first experience with visualizations was as a research associate at Brown University, where she spent three years. Her time in academia convinced Chen that it was where she wanted to stay.
So, despite offers from labs, she took a teaching job at the University of Southern Mississippi. During her three years as an assistant professor, Chen taught both undergraduate and graduate courses like Software Engineering, C Programming, Game Design, 3D Interaction, and Visualization. She started a lab, the Interactive Visual Computing Lab (IVCL), which she hopes to one day bring to UMBC.
“It is an honor for me to join UMBC,” says Chen, who will be teaching Data Structures this fall. Her advice for students who take her class in the fall is to use the knowledge you learn in the classroom to solve real-world problems—not surprising, considering this is what Chen’s research is all about.