<- previous index next ->
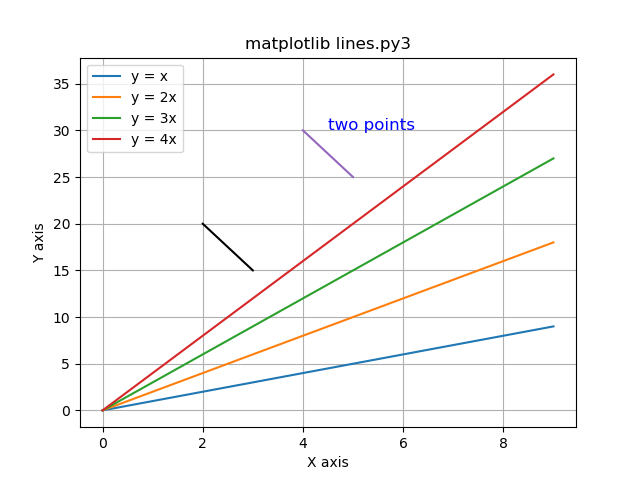
First we cover the very powerful python matplotlib package.
This has been available for both python2 and python3
and possibly not by default.
pip install matplotlib # command may have been needed
The code for python code shown below can be obtained on linux.gl by:
cp /afs/umbc.edu/users/s/q/squire/pub/download/lines.py3 .
cp /afs/umbc.edu/users/s/q/squire/pub/download/lines.py .
cp /afs/umbc.edu/users/s/q/squire/pub/download/plotm1.py3 .
cp /afs/umbc.edu/users/s/q/squire/pub/download/plotm1.py .
cp /afs/umbc.edu/users/s/q/squire/pub/download/donut.py3 .
cp /afs/umbc.edu/users/s/q/squire/pub/download/donut.py .
cp /afs/umbc.edu/users/s/q/squire/pub/download/plotm3d1.py3 .
cp /afs/umbc.edu/users/s/q/squire/pub/download/plotm3d1.py .
cp /afs/umbc.edu/users/s/q/squire/pub/download/plotm3d2.py3 .
cp /afs/umbc.edu/users/s/q/squire/pub/download/plotm3d2.py .
cp /afs/umbc.edu/users/s/q/squire/pub/download/cosexp.py3 .
cp /afs/umbc.edu/users/s/q/squire/pub/download/plotmesh.py3 .
cp /afs/umbc.edu/users/s/q/squire/pub/download/pyplot_two_subplots.py3 .
lines.py3 use matplotlib
 lines_py3.out printed output
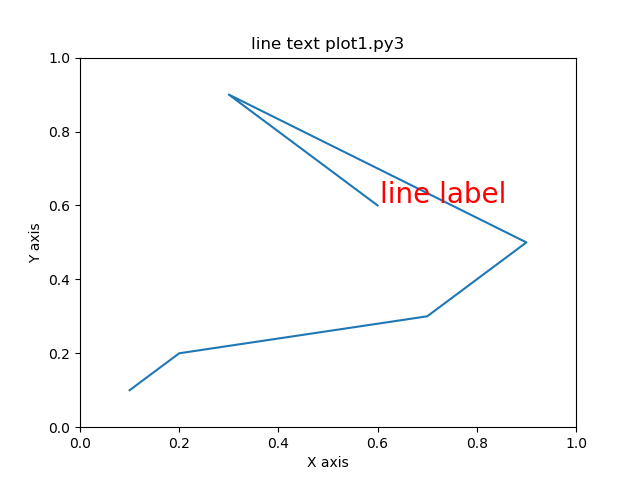
plotm1.py3 use matplotlib
lines_py3.out printed output
plotm1.py3 use matplotlib
 plotm1_py3.out printed output
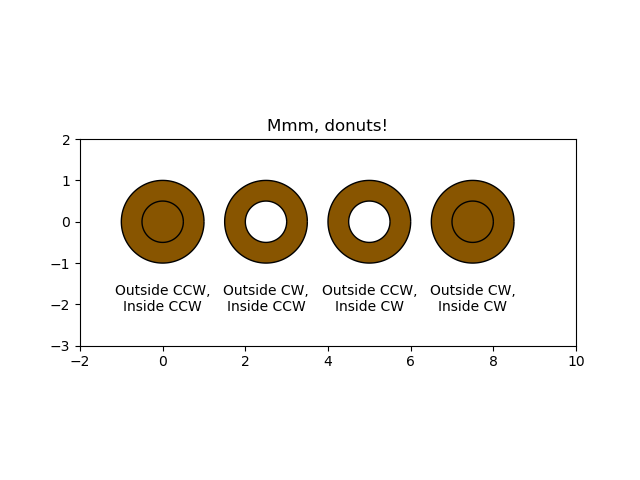
donut.py3 use matplotlib
plotm1_py3.out printed output
donut.py3 use matplotlib
 donut_py3.out printed output
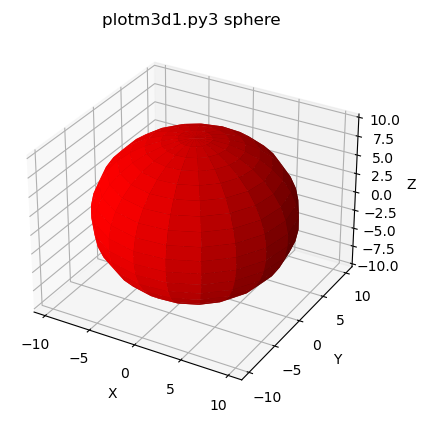
plotm3d1.py3 use matplotlib
donut_py3.out printed output
plotm3d1.py3 use matplotlib
 plotm3d1_py3.out printed output
a modified x,y,z
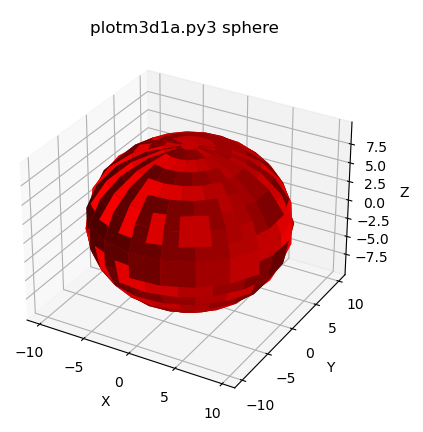
plotm3d1a.py3 use matplotlib
plotm3d1_py3.out printed output
a modified x,y,z
plotm3d1a.py3 use matplotlib
 plotm3d1a_py3.out printed output
b modified x,y,z
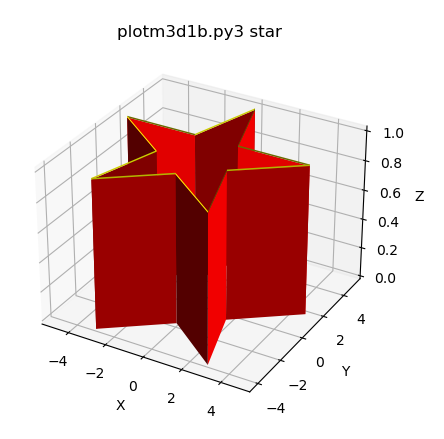
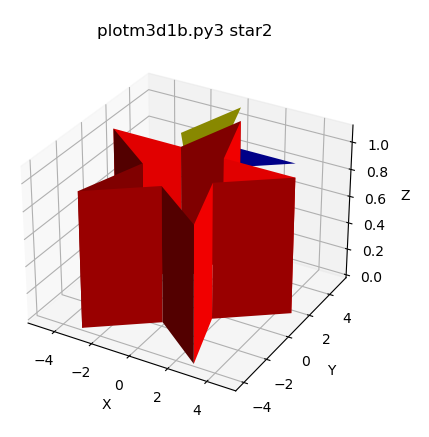
plotm3d1b.py3 use matplotlib
plotm3d1a_py3.out printed output
b modified x,y,z
plotm3d1b.py3 use matplotlib
 plotm3d1b_py3.out printed output
c modified x,y,z
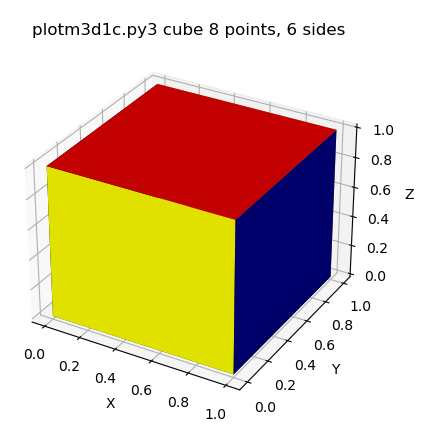
plotm3d1c.py3 use matplotlib
plotm3d1b_py3.out printed output
c modified x,y,z
plotm3d1c.py3 use matplotlib
 plotm3d1c_py3.out printed output
d modified x,y,z
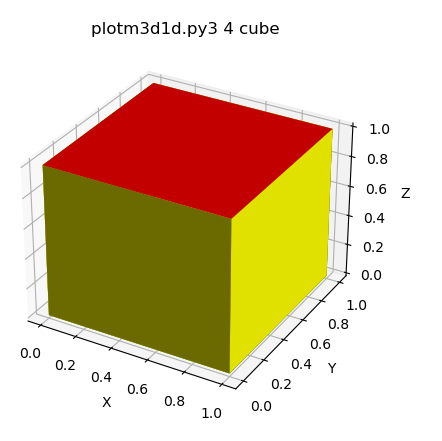
plotm3d1d.py3 use matplotlib
plotm3d1c_py3.out printed output
d modified x,y,z
plotm3d1d.py3 use matplotlib
 plotm3d1d_py3.out printed output
t modified x,y,z
plotm3d1t.py3 use matplotlib
plotm3d1d_py3.out printed output
t modified x,y,z
plotm3d1t.py3 use matplotlib
 plotm3d1t_py3.out printed output
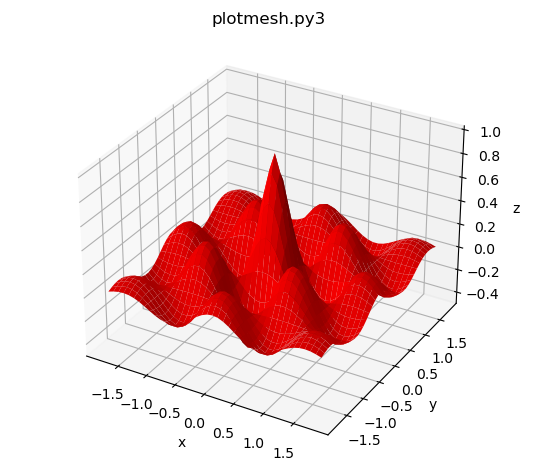
plotmesh.py3 use matplotlib
plotm3d1t_py3.out printed output
plotmesh.py3 use matplotlib
 plotmesh_py3.out printed output
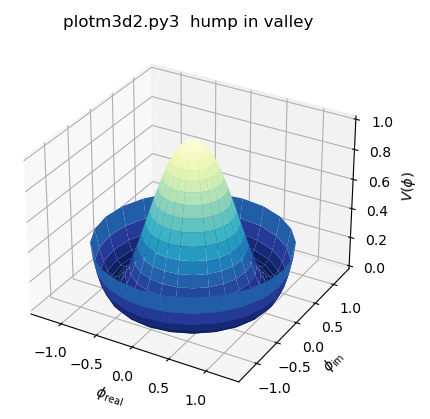
plotm3d2.py3 use matplotlib
plotmesh_py3.out printed output
plotm3d2.py3 use matplotlib
 plotm3d2_py3.out printed output
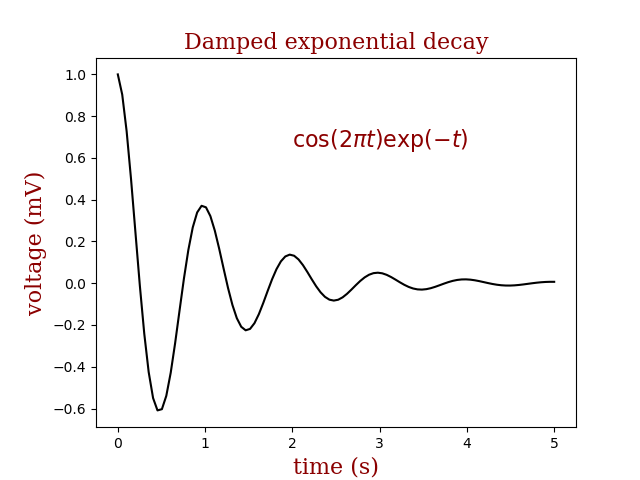
cosexp.py3 use matplotlib
plotm3d2_py3.out printed output
cosexp.py3 use matplotlib
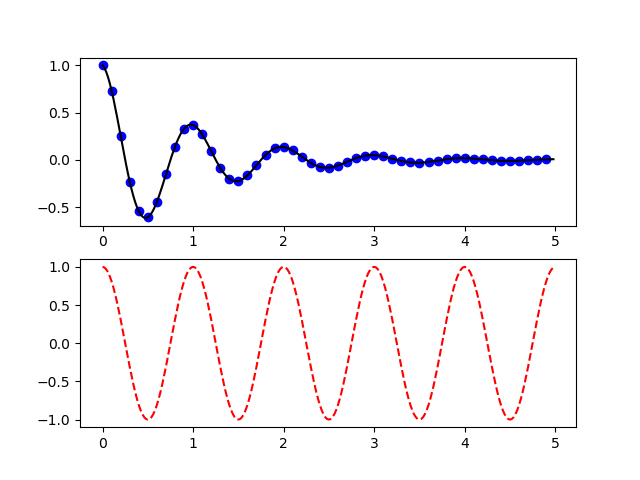
 pylab_two_subplots.py3 use matplotlib
 Many more matplotlib examples are available at
https://matplotlib.org/examples/index.html
Next we cover the very useful python pylab package.
This has been available for both python2 and python3
and possibly not by default.
pip install pylab # command may have been needed
The code for python code shown below can be obtained on linux.gl by:
cp /afs/umbc.edu/users/s/q/squire/pub/download/sin_plot_mat.py3 .
cp /afs/umbc.edu/users/s/q/squire/pub/download/test_rand.py3 .
cp /afs/umbc.edu/users/s/q/squire/pub/download/test_polyfit.py3 .
cp /afs/umbc.edu/users/s/q/squire/pub/download/test_mypolyfit.py3 .
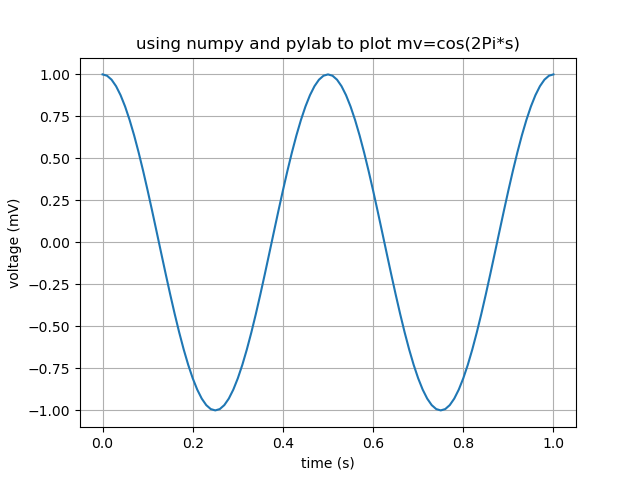
sin_plot_mat.py3 use pylab
Many more matplotlib examples are available at
https://matplotlib.org/examples/index.html
Next we cover the very useful python pylab package.
This has been available for both python2 and python3
and possibly not by default.
pip install pylab # command may have been needed
The code for python code shown below can be obtained on linux.gl by:
cp /afs/umbc.edu/users/s/q/squire/pub/download/sin_plot_mat.py3 .
cp /afs/umbc.edu/users/s/q/squire/pub/download/test_rand.py3 .
cp /afs/umbc.edu/users/s/q/squire/pub/download/test_polyfit.py3 .
cp /afs/umbc.edu/users/s/q/squire/pub/download/test_mypolyfit.py3 .
sin_plot_mat.py3 use pylab
 test_rand.py3 use pylab
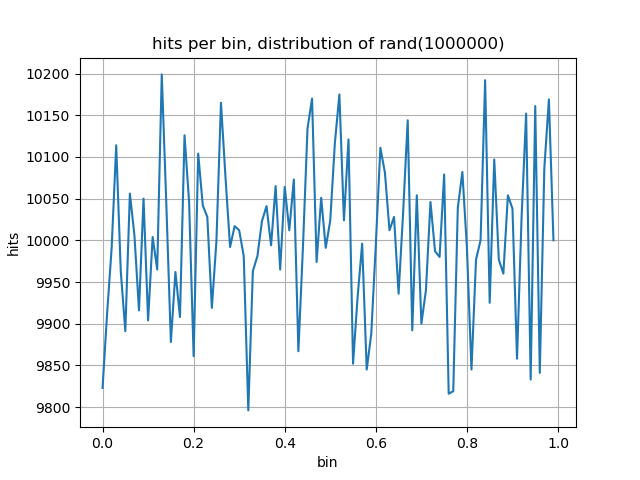
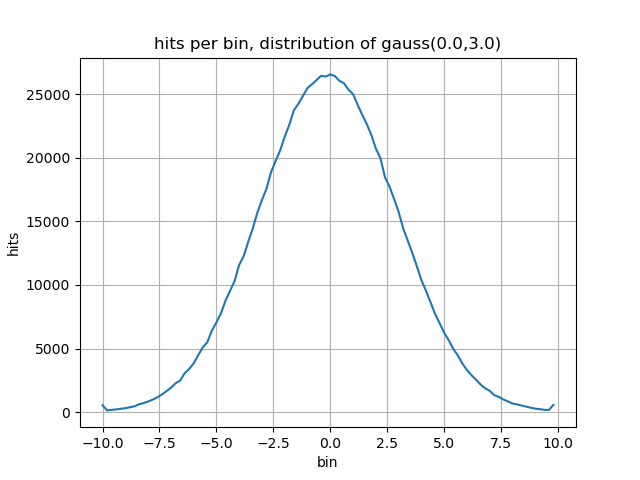 test_rand_py3.out printed output
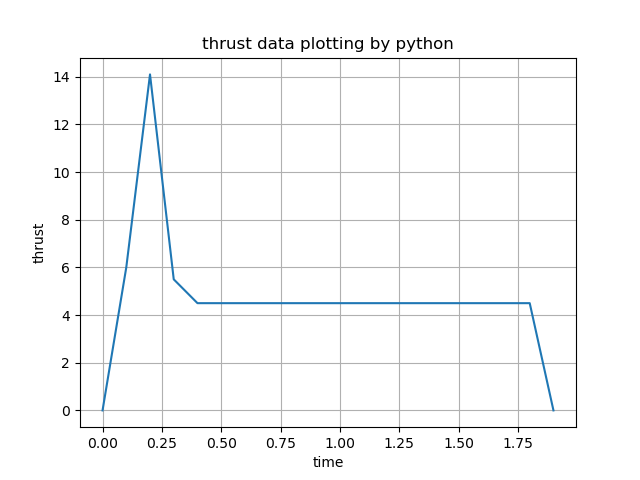
test_polyfit.py3 use pylab
test_rand_py3.out printed output
test_polyfit.py3 use pylab
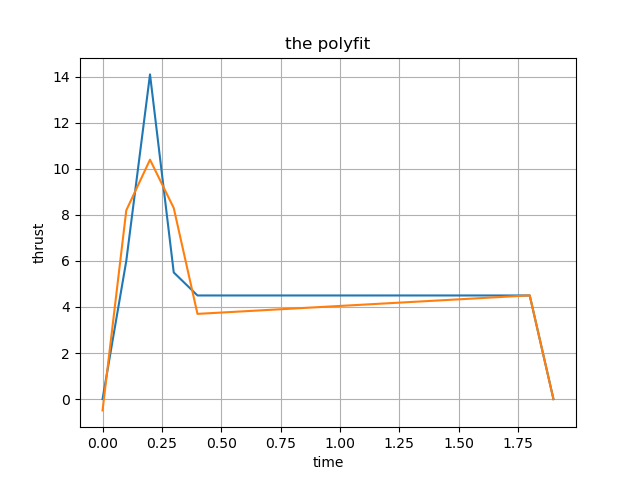 test_polyfit_py3.out printed
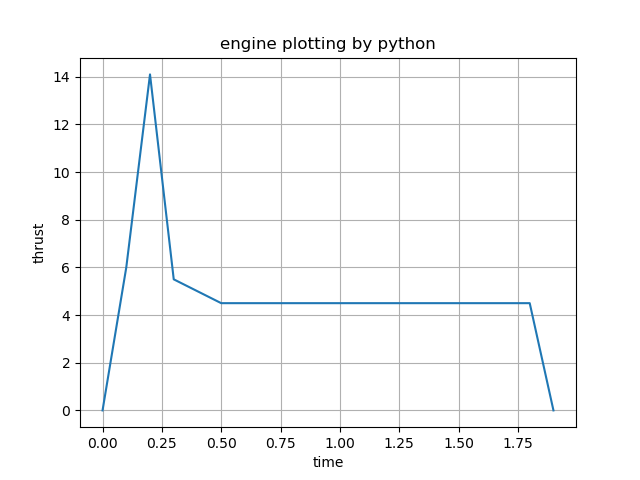
test_mypolyfit.py3 use pylab
test_polyfit_py3.out printed
test_mypolyfit.py3 use pylab
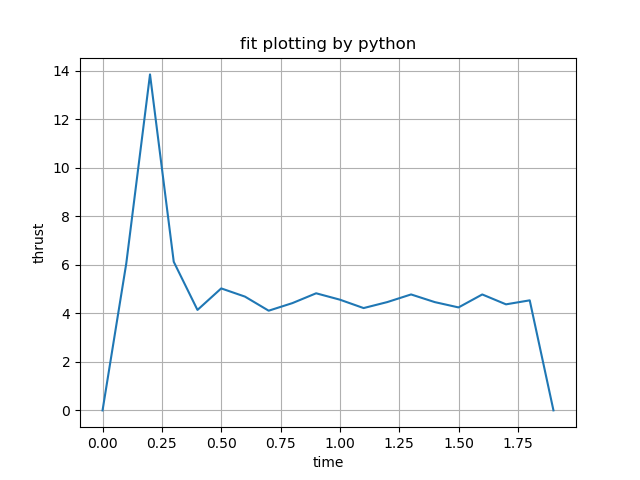 test_mypolyfit_py3.out printed
More examples available by search python pylab examples
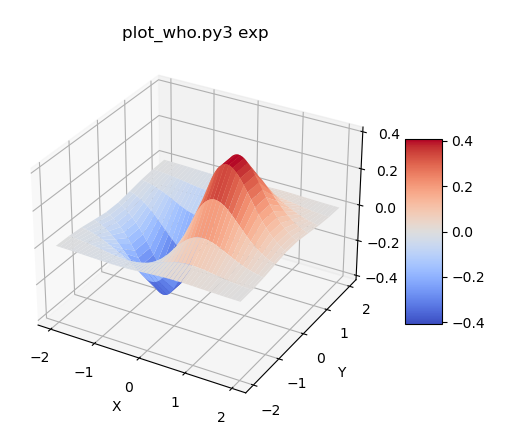
plot_who.py3 use plot_surface
test_mypolyfit_py3.out printed
More examples available by search python pylab examples
plot_who.py3 use plot_surface
 plot_who2.py3 use plot_surface
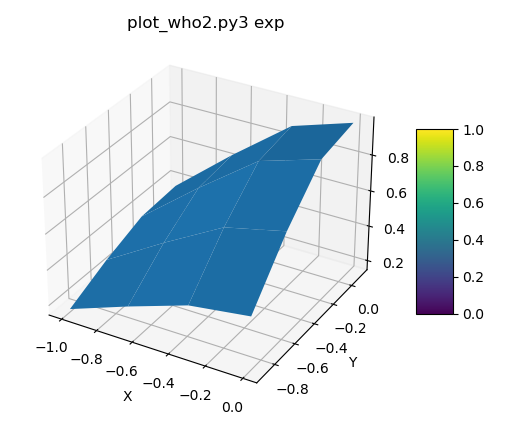 plot_who2_py3.out printed output
plot_who3.py3 use plot_surface
plot_who2_py3.out printed output
plot_who3.py3 use plot_surface
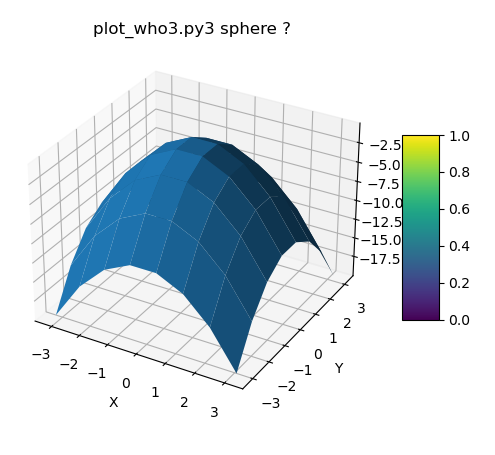 plot_who3_py3.out printed output
plot_who4.py3 use plot_surface
plot_who3_py3.out printed output
plot_who4.py3 use plot_surface
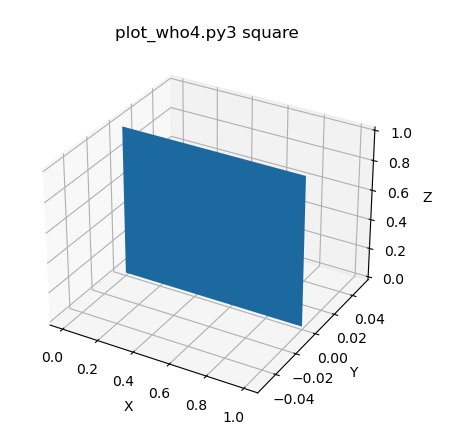 plot_who4_py3.out printed output
plot_who4a.py3 use plot_surface
plot_who4_py3.out printed output
plot_who4a.py3 use plot_surface
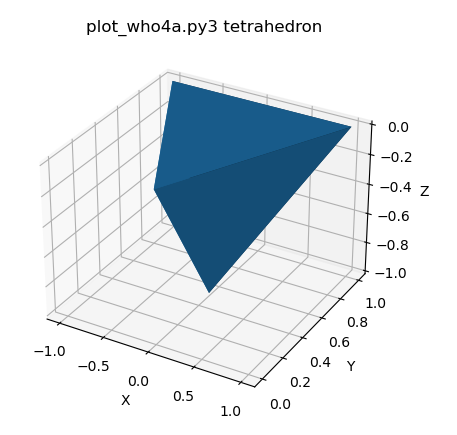 plot_who4a_py3.out printed output
plot_who5.py3 use plot_surface rotate
plot_who4a_py3.out printed output
plot_who5.py3 use plot_surface rotate
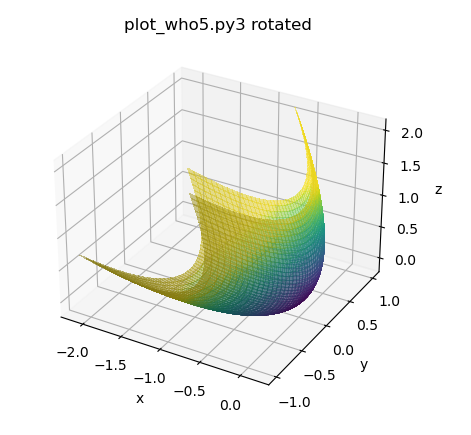 plot_who5_py3.out printed output
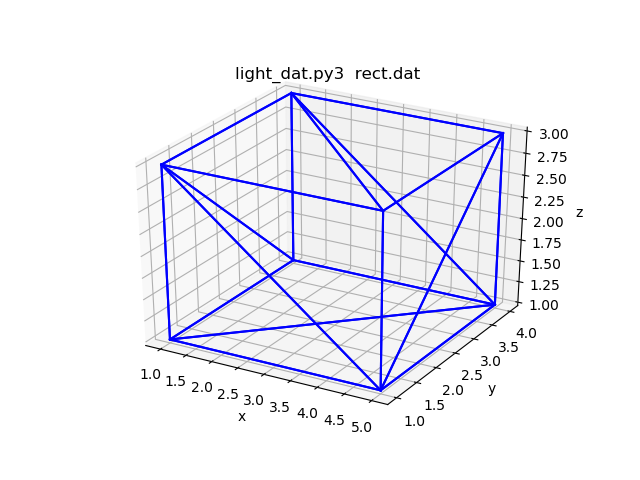
Now applications to plot Utah Graphics .dat files
and 3D printer .stl files.
light_dat.py3
rect.dat
plot_who5_py3.out printed output
Now applications to plot Utah Graphics .dat files
and 3D printer .stl files.
light_dat.py3
rect.dat
 light_stl.py3
rect.stl
light_stl.py3
rect.stl

<- previous index next ->
Many web sites on Java GUI, AWT, Swing, etc.
Many web sites on Python wx, tk, qt, etc.