Ph.D. Defense
Multivariate Time Series Analysis
of Physiological and Clinical Data
Patti Ordóñez Rozo
1:00pm Thursday, 29 March 29 2012, ITE 325b UMBC
The complexity and volume of collected medical data is greater now than at any point in the history of medicine. Medical providers are expected to examine large volumes of data and identify correlations among parameters based on their own clinical experience to detect significant medical events or conditions. The information overload that providers may face may hinder the diagnostic process. Most existing visualizations of the data to assist the provider in analyzing the information consist of a table or plot of values for a particular parameter as a function of time. Automated techniques for discovering these correlations not only may assist the provider in making a diagnosis but may help to identify hidden patterns within the data associated with specific medical conditions or events. Current visualization and machine learning techniques show promise for extracting this information.
This dissertation presents three novel representations and two visualizations to assist in the analysis of multivariate time series data. It focuses on physiological and clinical data, in particular, because this type of data captures the complexity of a human being, and thus, the multivariate time series in this type of data are more interdependent and synchronized than most. The three representations are the Multivariate Time Series Amalgam (MTSA), the Stacked Bags-of-Patterns (Stacked BoP), and the Multivariate Bag-of-Patterns (Multivariate BoP). Each provides an integrated, multivariate approach for representing multivariate time series data. An evaluation of the latter two techniques against two techniques that use univariate techniques of multiple variables, Ensemble Voting with Bag-of-Patterns and Multivariate Piecewise Dynamic Time Warping in five diverse datasets yields interesting insights into the classification of multivariate time series.
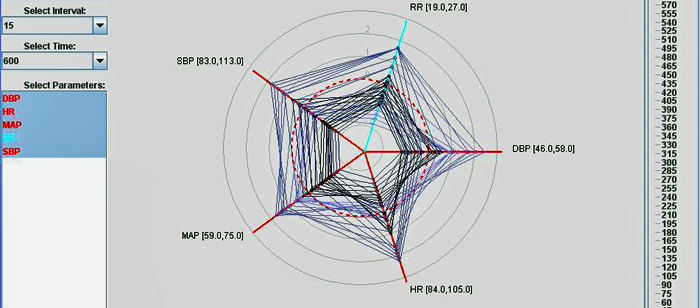
The MTSA representation is the foundation for two visualizations – the MTSA Visualization and the Fixed Dual MTSA Visualization. These animated visualizations capture the rate of change of provider-selected parameters and the relationships among them. While both visualizations were created for the medical domain, they generalize to domains where multiple variables measure the state of an entity as a function of time. An evaluation of the Fixed Dual MTSA Visualization was carried out with 23 pediatric residents at Johns Hopkins University School of Medicine. The results indicate that the visualization merits further investigation for use as a diagnostic tool.
Committee
- Dr. Tim Oates (co-chair)
- Dr. Marie desJardins (co-chair)
- Dr. Anupam Joshi
- Dr. Jim Fackler, JHMI
- Dr. Christoph U. Lehmann, JHMI