Oracle8i Application Developer's Guide - Fundamentals
Release 8.1.5

A68003-01

Library

Product

Contents

Index

Prev Next

2
Visual Modelling for Software Development

This chapter contains information on Unified Modelling Language notation and diagrams. The topics include:

Why Employ Visual Modelling?

When application developers gather together to discuss a project, it is only a matter of minutes before someone starts sketching on a white board or pad in order to describe the problems and outline solutions. They do so because they instinctively recognize that a mixture of graphics and text is the fastest way to delineate the complex relationships entailed in software development. Participants in these meetings often end up copying down these sketches as a basis for later code development.

Unified Modelling Language

One problem with this process is that whoever creates the diagrams has to invent a notation to adequately represent the issues under discussion. Fortunately, many of the types of problems are familiar, and everyone who is in the room can ask questions about what is meant by the lines and edges. But this raises further problems: What about members of a development team who are not present? Indeed, even people who were there may later lose track of the logic underlying their notes.

To counter these difficulties, this Application Developer's documentation set uses a graphic notation defined by the Unified Modelling Language (UML), an industry-wide standard specifically created for modelling software systems. Describing the UML in its entirety is beyond the scope of the book. However, we do explain the small subset of the UML notation that we employ.

Illustrations and Diagrams

Software documentation has always contained figures. What, then, is the difference between UML-based diagrams used for modelling software development and the figures that have traditionally been used to illustrate different topics? We make a distinction between two kinds of figures in this book:

The two different types are always distinguished in the figure title. The term diagram is always used for the following examples:

Example of an Illustration

Figure 2-1 illustrates the macro-steps entailed in creating a multimedia application. While it may be useful in planning software development from an organizational standpoint, it does not provide any help for the actual coding.

Figure 2-1 Example of an Illustration: The Multimedia Authoring Process


Example of A Diagram

In contrast to Figure 2-1, Figure 2-2 describes what you must do to enqueue a message using Oracle Advanced Queuing: You must specify a queue name, specify the message properties, specify from among various options, and add the message payload. This diagram is then complemented by further diagrams, as indicated by the drop shadows around the latter three ellipses.
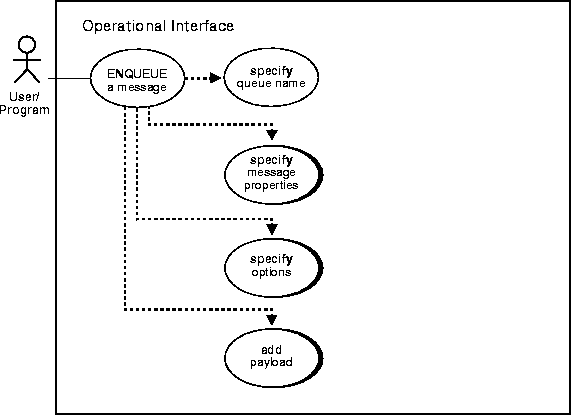
Figure 2-2 Use Case Diagram: Enqueue a Message


Use Cases

The UML contains a number of different kinds of diagrams.This release of the Application Developer's documentation set introduces the UML into documentation principally by way of use cases. Use cases are generally employed to describe the set of activities that comprise the sum of the application scenarios.
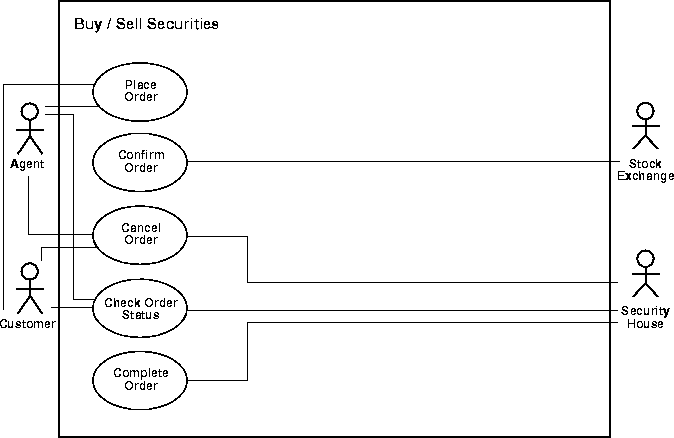
Figure 2-3 Use Cases


The following section is a selection of UML elements that are used in this book.

Use Case Diagrams

Graphic Element   Description  


This release of the documentation introduces and makes heavy use of the Use Case Diagram. Each primary use case is instigated by an actor ('stickman') that could be a human user, an application, or a sub-program.

The actor is connected to the primary use case which is depicted as an oval (bubble) enclosing the use case action.

The totality of primary use cases is described by means of a Use Case Model Diagram.  


Primary use cases may require other operations to complete them. In this diagram fragment:

  • specify queue name

Is one of the sub-operations, or secondary use cases, necessary to complete

  • ENQUEUE a message

Has the downward lines from the primary use case that lead to the other required operations (not shown)  


Secondary use cases that have drop shadows expand (they are described by means of their own use case diagrams). There are two reasons for this:

(a) It makes it easier to understand the logic of the operation.

(b) It would not have been possible to place all the operations and sub-operations on the same page.

In this example, specify message properties, specify options, and add payload are all expanded in separate use case diagrams.  


This diagram fragment shows the use case diagram expanded. While the standard diagram has the actor as the initiator), here the use case itself is the point of departure for the sub-operation.

In this example, the expanded view of add payload represents a constituent operation of ENQUEUE a message.  


This convention (a, b, c) shows that there are three different ways of creating a table that contains LOBs.  


This fragment shows use of a NOTE box, here distinguishing which of the three ways of creating a table containing LOBs.  


Graphic Element
 
Description

This drawing shows two other common sees of NOTE boxes:

(a) A way of presenting an alternative name, as in this case the action SELECT propagation schedules in the user schema is represented by the view USER_QUEUE_SCHEDULES

(b) The action list attribute names is qualified by the note to the user that you must list at least one attribute if you elect not to list all the propagation schedule attributes.  


Graphic Element   Description  


The dotted arrow in the use case diagram indicates dependency. In this example, free a temporary LOB requires that you first create a temporary LOB.

This means that you should not execute the free operation on a LOB that is not temporary.

What you need to remember is that the target of the arrow shows the operation that must be performed first.  


Use cases and their sub-operations can be linked in complex relationships.

In this example of a callback, you must first REGISTER for notification in order to later receive a notification.  

Graphic Element
 
Description

In this case, the branching paths of an OR condition are shown. In invoking the view, you may either choose to list all the attributes or to view one or more attributes. The fact that you can stipulate which of the attributes you want made visible is indicated by the grayed arrow.  


Graphic Element
 
Description

Not all lined operations are mandatory. While the black dashed-line and arrow indicate that you must perform the targeted operation to complete the use case, actions that are optional are shown by the grey dashed-line and arrow.

In this example, executing WRITEAPPEND on a LOB requires that you first SELECT a LOB.

As a facilitating operations, you may choose to OPEN a LOB and/or GETCHUNKSIZE.

However, note that if you OPEN a LOB, you will later have to CLOSE it.  

State Diagrams


Graphic Element
 
Description

All the previous notes have dealt with use case diagrams. Here we introduce the very basic application of a state diagram that we utilize in this book to present the attributes of a view. In fact, attributes of a view have only two states -- visible or invisible.

We attempt to show what you might make visible in invoking the view. Accordingly, we have extended the UML to join a partial state diagram onto a use case diagram to show the totality of attributes, and thereby all the view sub-states of the view that you can see. We have demarcated the use case from the view state by coloring the background of the state diagram grey.

In this example, the view AQ$<queue_table_name>_S allows you to query queue subscribers. You can stipulate one, some combination, or all of the four attributes.  


Graphic Element   Description  


Use Case Model Diagrams summarize all the use cases in a particular domain, such as Internal temporary LOBs. Often, these diagrams are too complex to contain within a single page.

When that happens we resort to dividing the diagram into two parts. Please note that there is no sequence implied in this division.  


In some cases, we have had to split a diagram simply because it is too long for the page. In such cases, we have included this marker.  


Prev

Next
Oracle
Copyright © 1999 Oracle Corporation.

All Rights Reserved.

Library

Product

Contents

Index