<- previous index next ->
Technically a vector can be normal to another vector.
Being "normal" means at 90 degrees, a right angle.
A line is technically a vector with values for x,y,z [x,y,z]
Given two 3D points p1 and p2, they define a line:
[p2x-p1x, p2y-p1y, p2z-p1z] = [x,y,z] vector.
We call the normal [nx, ny, nz]
Typically length 1.0 = nx*nx + ny*ny + nz*nz
For [nx,ny,nz] to be normal to [x,y,z] the dot product must be zero.
0 = x*nx + y*ny + z*nz
Obviously there are many normal vectors to any vector.
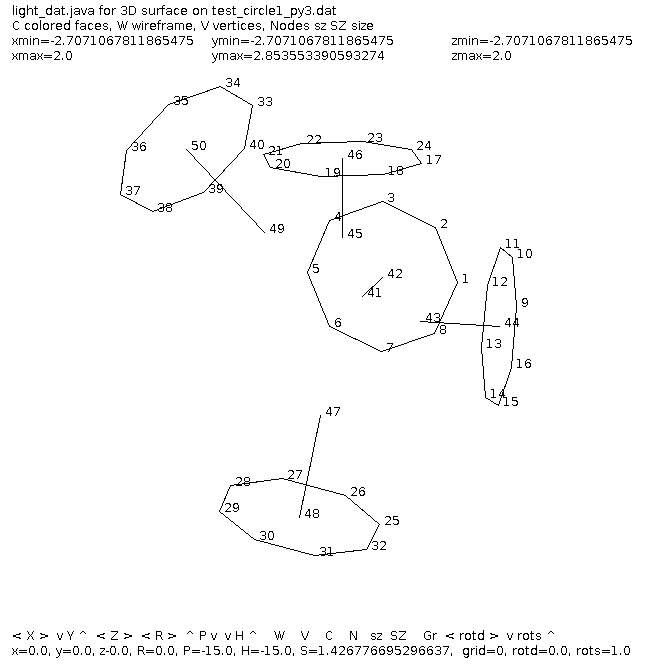
I want 8 normals that are equally angled that are
on a circle for my graphical display.
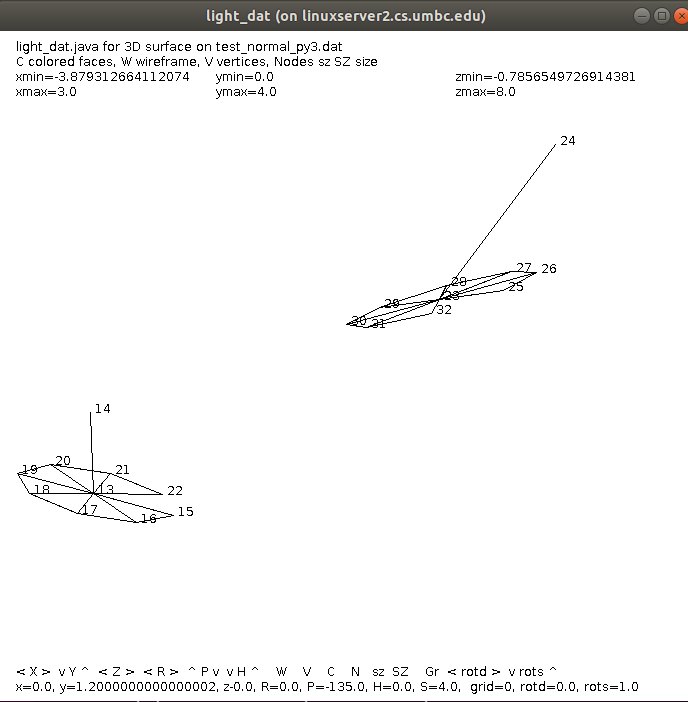
I tested my code on 26 vectors in different directions.
Only 4 are plotted at a time, using my drawc function.
The source code, output, and graphics are:
test_add_normal.py3 source code
test_add_normal_py3.out output
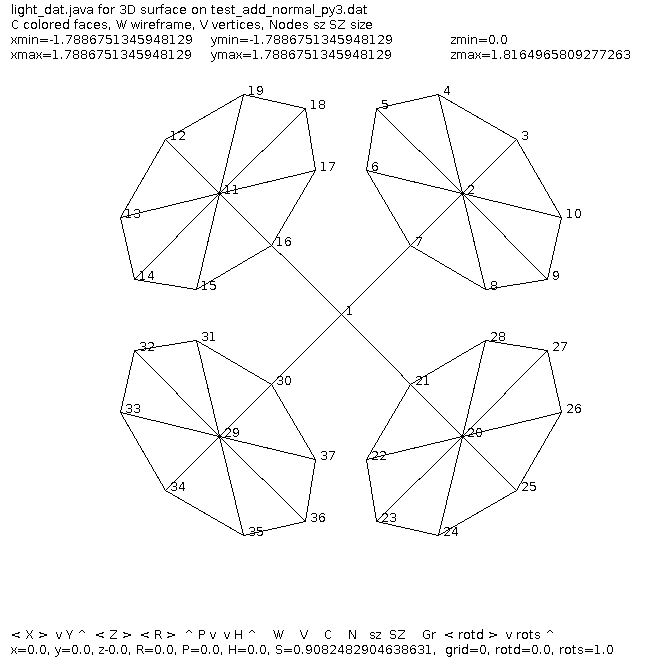 Four sets of normal vectors to p111, p222, p333, p444
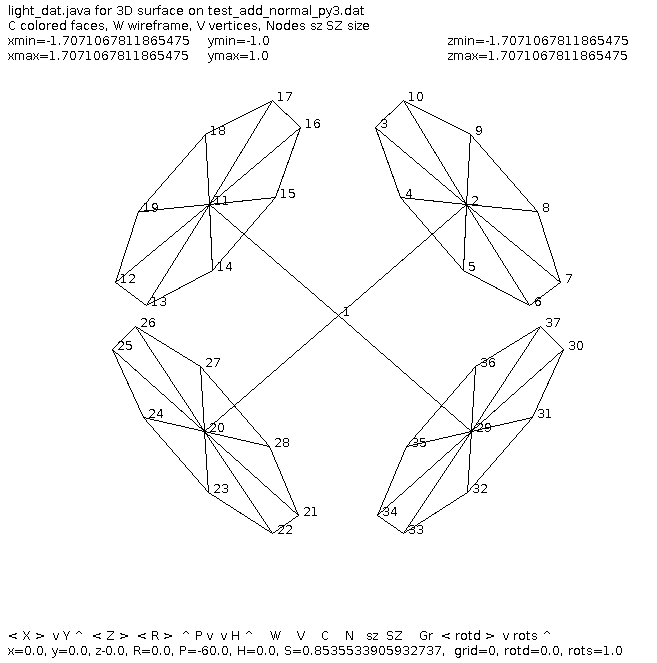
 four sets of normal vectord to py1, py2, pz1, pz2
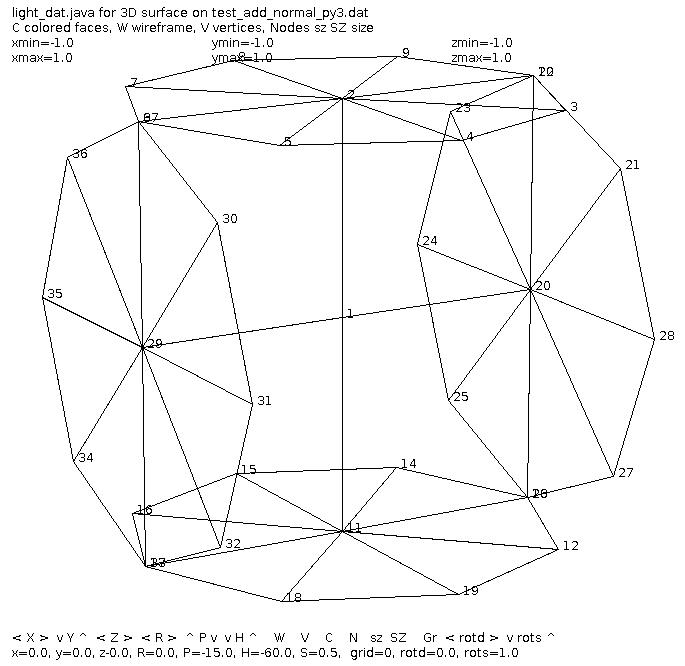
 Four sets of normal vectors to pxz1, pxz2, pxz3, pxz4
The image is unreadable if all 26 are in one image.
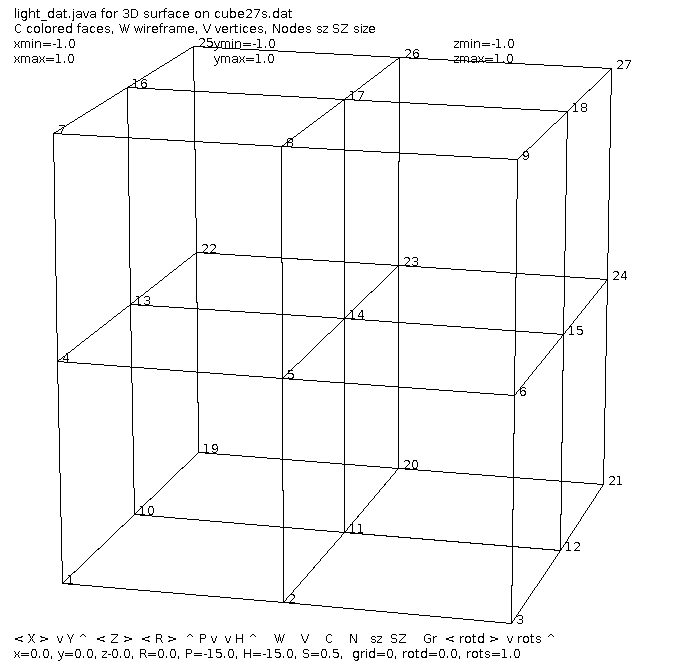
The 26 directions are from the center of cube27
to vertices.
Four sets of normal vectors to pxz1, pxz2, pxz3, pxz4
The image is unreadable if all 26 are in one image.
The 26 directions are from the center of cube27
to vertices.
 Older programs plotting normals are shown below:
test_circle1.py3 source code
Older programs plotting normals are shown below:
test_circle1.py3 source code
 test_normal.py3 source code
<- previous index next ->
Many web sites on Java GUI, AWT, Swing, etc.
Many web sites on Python wx, tk, qt, etc.