<- previous index next ->
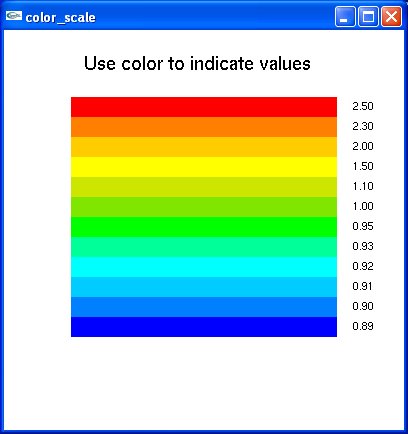
Color can be used to indicate values. On a 2D plot, the height or
value may be shown with color variation. On a 3D plot the color
can show a fourth dimension value such as temperature.
In OpenGL:
A simple program that manually creates colors and values is
color_scale.c that displays
 A more typical output where colors and values may be generated
by the program may look like
A more typical output where colors and values may be generated
by the program may look like
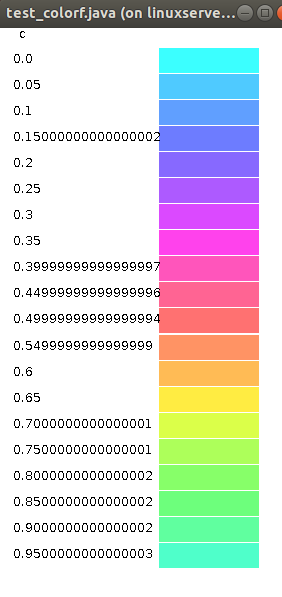
 A java program to convert numbers from 0.0 to 1.0 to colors.
colorf.java source code
test_colorfa.java source code
test_colorfa_java.out output
A java program to convert numbers from 0.0 to 1.0 to colors.
colorf.java source code
test_colorfa.java source code
test_colorfa_java.out output
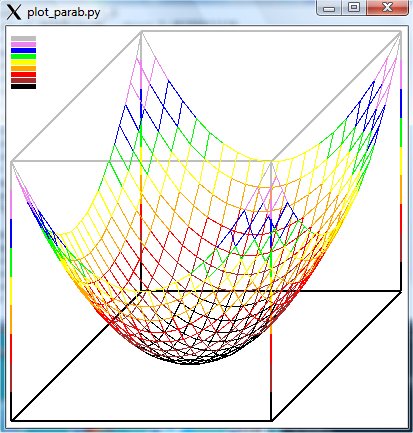
 A Python Tk program to do an orthographic plot of a wire frame,
with color of edge representing z value of z=x*x+y*y
plot_parab.py that displays
A Python Tk program to do an orthographic plot of a wire frame,
with color of edge representing z value of z=x*x+y*y
plot_parab.py that displays
 A Java graphics program to do orthographic plot of a wire frame,
with color of edge representing z value of z=x*x+y*y+t
plot_parab.java that displays
A Java graphics program to do orthographic plot of a wire frame,
with color of edge representing z value of z=x*x+y*y+t
plot_parab.java that displays
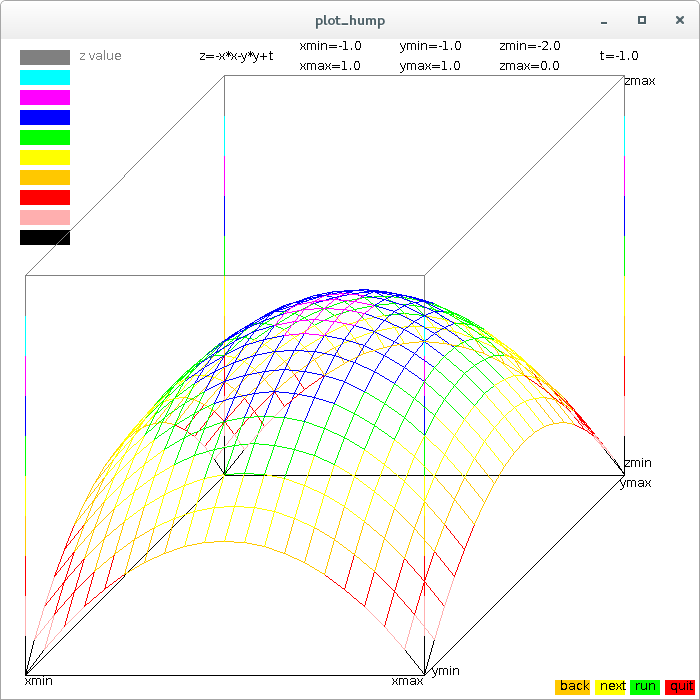
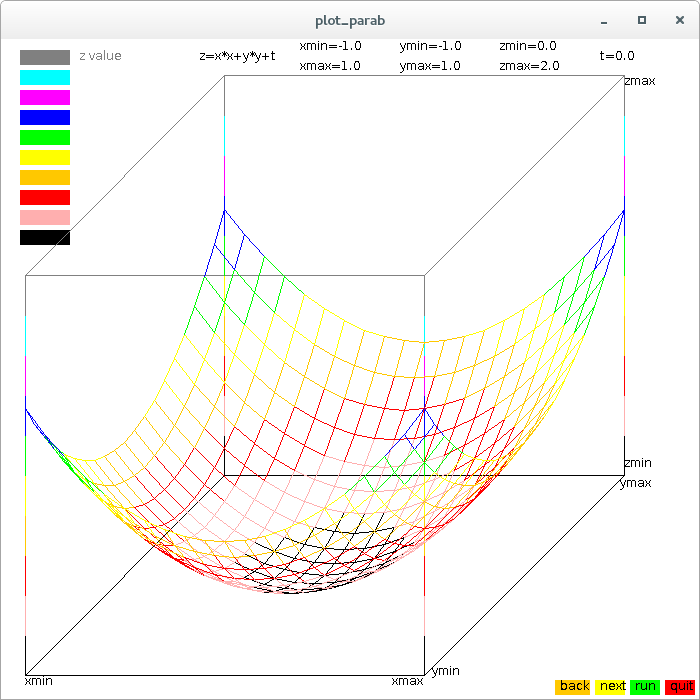 This has a "run" button that increases t and causes crude motion.
with color of edge representing z value of z=-x*x-y*y+t
plot_hump.java
This has a "run" button that increases t and causes crude motion.
with color of edge representing z value of z=-x*x-y*y+t
plot_hump.java
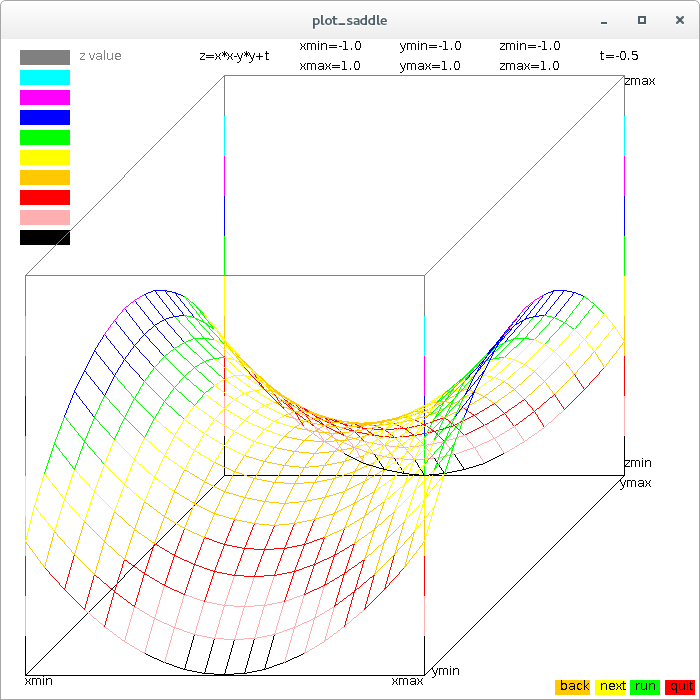
 with color of edge representing z value of z=x*x-y*y+t
plot_saddle.java
with color of edge representing z value of z=x*x-y*y+t
plot_saddle.java
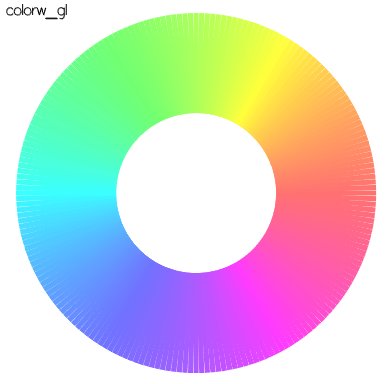
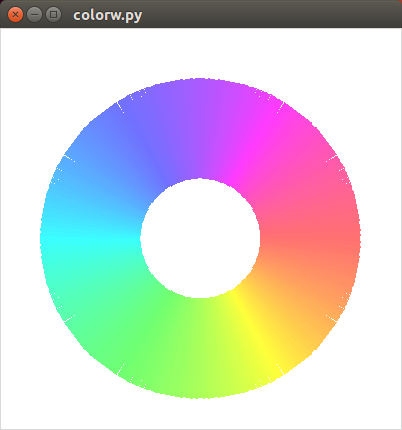
 A sample program that generates many colors and displays a color wheel
colorw_gl.c that displays
A sample program that generates many colors and displays a color wheel
colorw_gl.c that displays
 A sample program that generates many colors and displays a color wheel
colorw.py that displays
A sample program that generates many colors and displays a color wheel
colorw.py that displays
 Note that the RGB must be changed in combinations, not individually.
Note also that a specific display or specific person reaches a
place where adjacent colors appear the same.
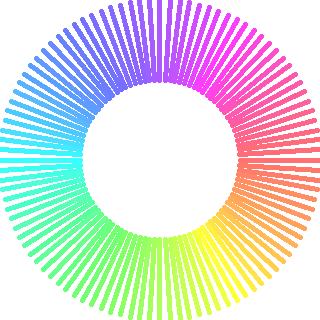
To see the similarity with various graphics packages, the X Windows
version of color wheel is colorw.c that displays
Note that the RGB must be changed in combinations, not individually.
Note also that a specific display or specific person reaches a
place where adjacent colors appear the same.
To see the similarity with various graphics packages, the X Windows
version of color wheel is colorw.c that displays
 Then java and python versions of color wheel:
colorw.java
colorw.py
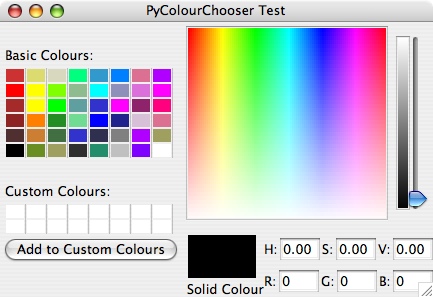
A small sample of python graphics and color is
pycolourchooser.py
Then java and python versions of color wheel:
colorw.java
colorw.py
A small sample of python graphics and color is
pycolourchooser.py
 The set of required files to build pycolourchooser is:
pycolourchooser
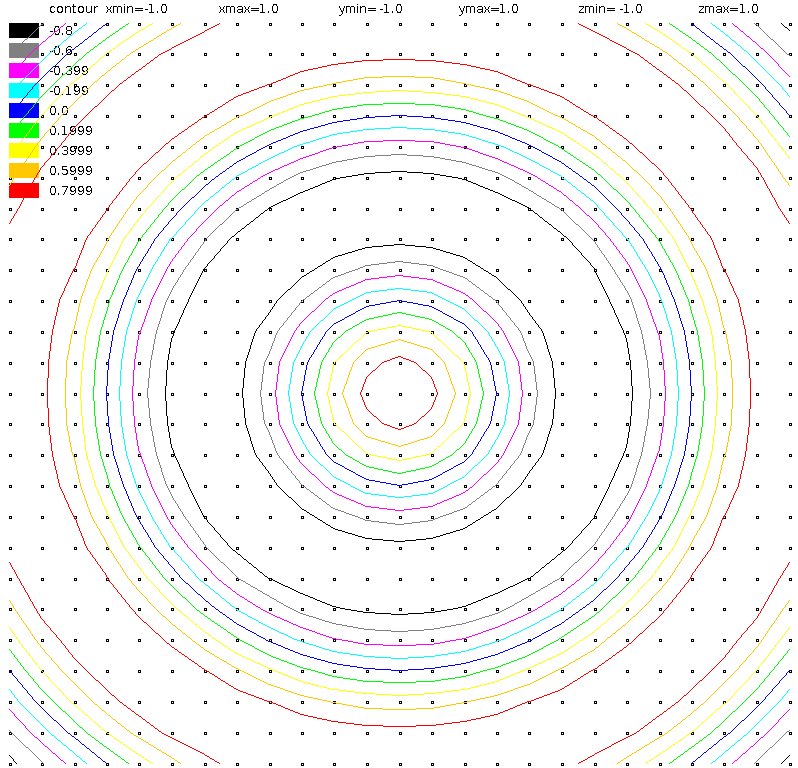
Contour Plots may be used to present information.
A simple program that reads x,y,z data, and
plots the z contour is:
ContourPlot1.java
for data cont1.dat
The set of required files to build pycolourchooser is:
pycolourchooser
Contour Plots may be used to present information.
A simple program that reads x,y,z data, and
plots the z contour is:
ContourPlot1.java
for data cont1.dat
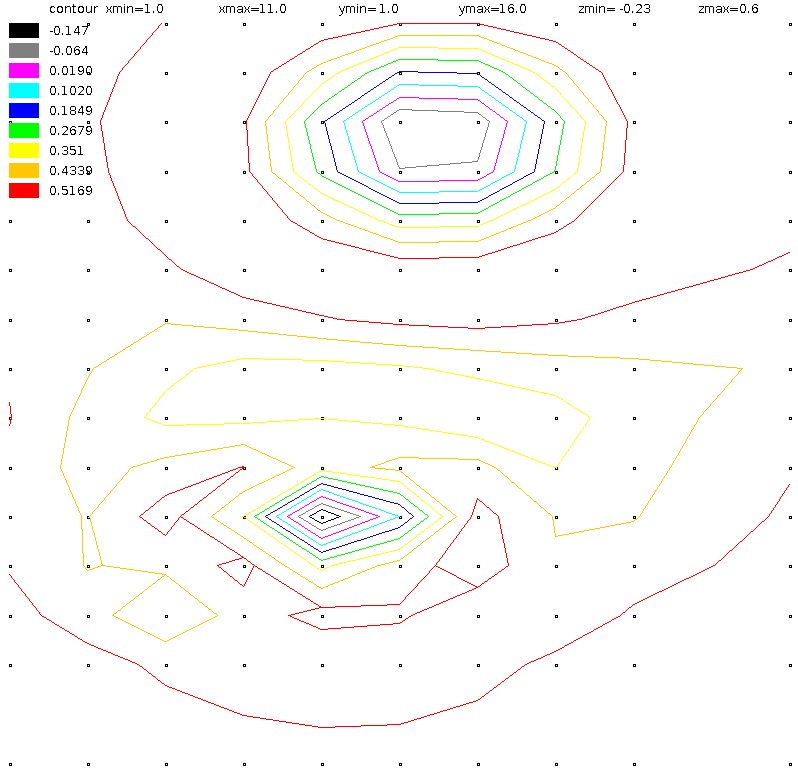 for data sinxypuv.dat x,y pressure velocity
ContourPlot1_java.out
for data sinxypuv.dat x,y pressure velocity
ContourPlot1_java.out
 Plot Utah Graphics .dat files with color options
plot2du.java source code
star3.dat data
Remove grid, change color X, Y, Z
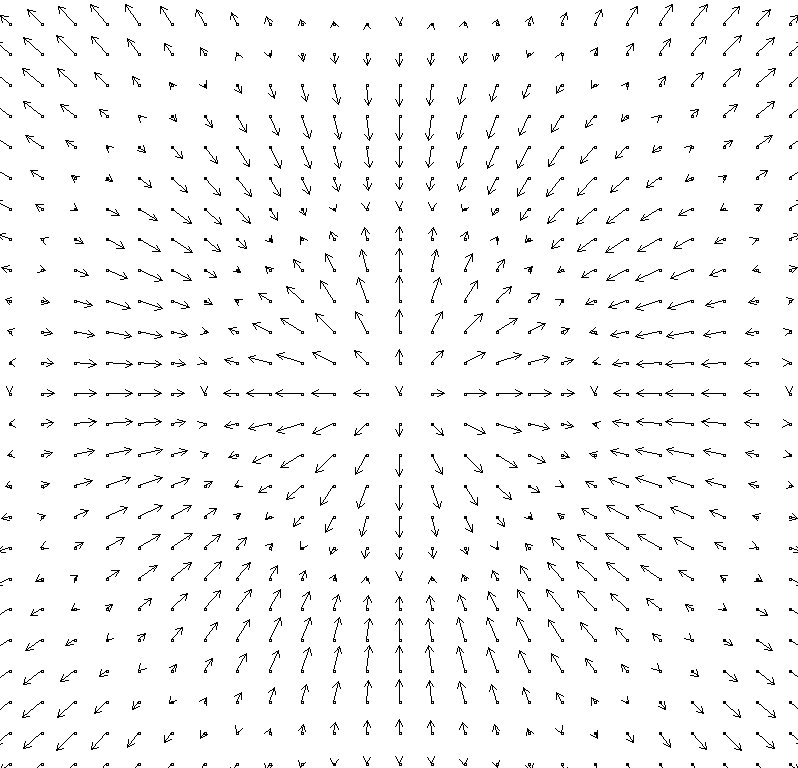
Not color, yet the companion to ContourPlot1 is VelocityPlot1.
Actually could be named VectorPlot1 because it takes the x,y
components of a vector and shows the relative length and direction.
Same data as above, using fourth and fifth columns.
VelocityPlot1_java.out
Plot Utah Graphics .dat files with color options
plot2du.java source code
star3.dat data
Remove grid, change color X, Y, Z
Not color, yet the companion to ContourPlot1 is VelocityPlot1.
Actually could be named VectorPlot1 because it takes the x,y
components of a vector and shows the relative length and direction.
Same data as above, using fourth and fifth columns.
VelocityPlot1_java.out
<- previous index next ->
Many web sites on Java GUI, AWT, Swing, etc.
Many web sites on Python wx, tk, qt, etc.