Shape in glyph-based visualization
Visualization of continuous data using shape in glyph-based visualization.
Pradyut Panda,
Department of Computer Science,
University of Maryland, Baltimore County.
Advisor: Dr. David Ebert.
15th July 1998.
The following images show some results of our work. These images are
screen captures of the stereoscopic field analyzer. We are using a sample
dataset with one of the data dimensions mapped to shape.
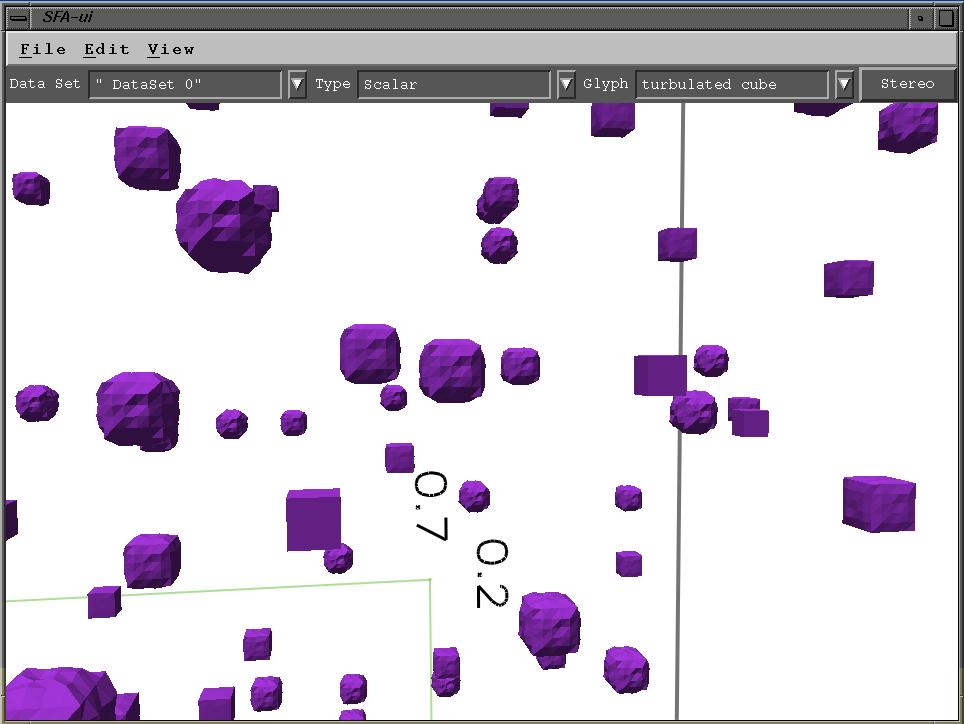
Glyph shape : Turbulence on a cube
In the first image, shape was generated using the turbulated cube algorithm.
The glyphs which have a cube shape have their data value close to 0. Glyphs
with data values close to 1.0 have a "fuzzy" cube
appearance.
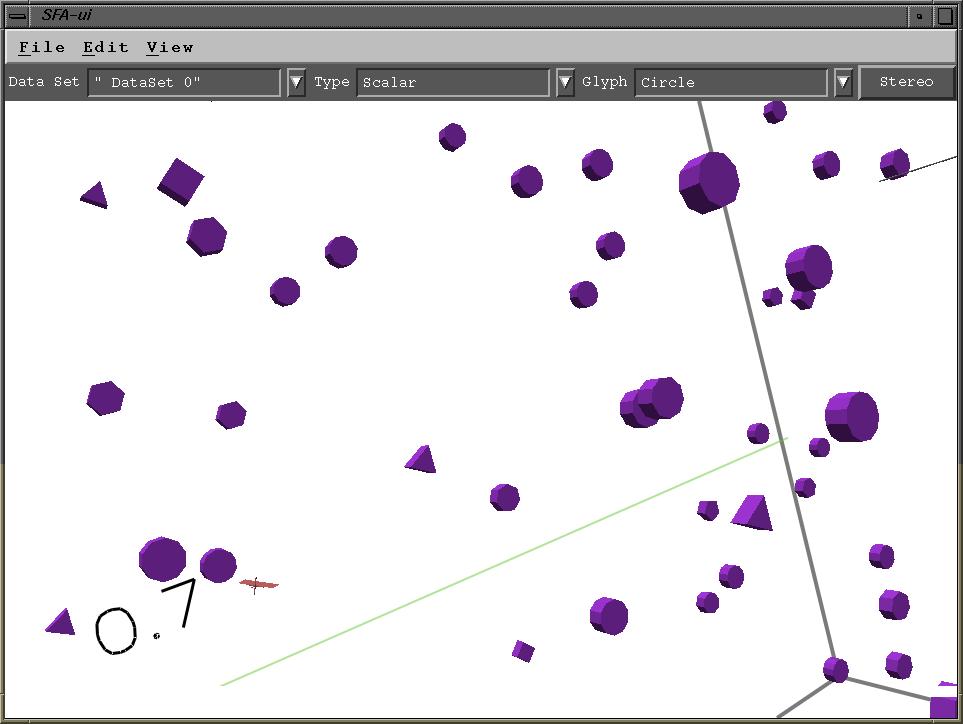
Glyph shape : Refinement of a circle
In this next image, the shape is generated using the refinement of shape
algorithm. The basic shape that was used is circle or rather a cylinder.
The minimum number of line segments used was 3. Ten distinct shapes were
used for this particular image. This gives us a bucket size of 0.1. Glyphs
with data values between 0.0 and 0.1 were rendered as an extended triangle.
Glyphs with data values close to 1.0 were rendered as 12 sided cylinders.
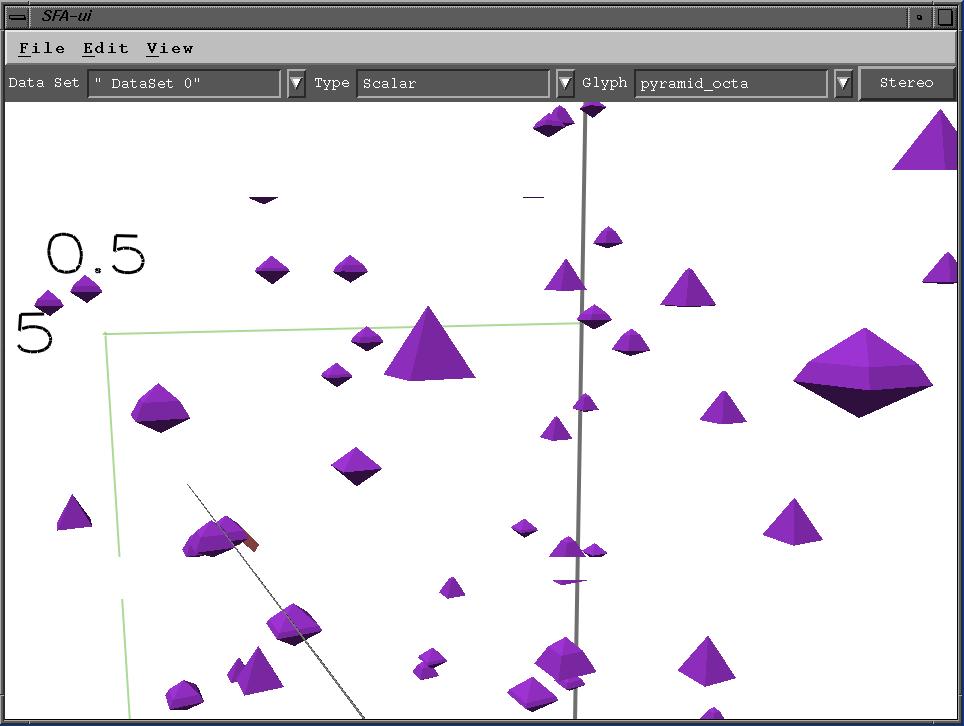
Glyph shape : Warping from a pyramid to an octahedron
In this image, the shape is generated by warping between two pre-defined
shapes. The particular shapes used here were the tetrahedron or pyramid
and the octahedron. Glyphs with data values close to 0.0 are pyramids and
glyphs with data values close to 1.0 are octahedrons.
Pradyut Panda