Release 8.1.5
A67775-01
Library |
Product |
Contents |
Index |
| Oracle8i Tuning Release 8.1.5 A67775-01 |
|
![]()
![]()
This chapter describes how to use Oracle Trace to collect Oracle server event data. It covers:
Oracle Trace is a general-purpose data collection product and is part of the Oracle Enterprise Manager systems management product family. The Oracle server uses Oracle Trace to collect performance and resource utilization data such as SQL Parse, Execute, Fetch statistics, and Wait statistics.
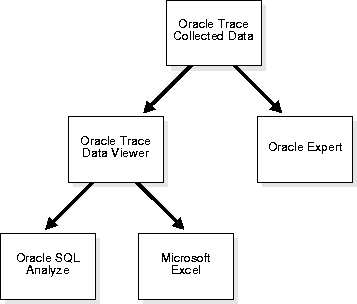
Among the many advantages of using Oracle Trace is the integration of Oracle Trace with many other applications. You can use Oracle Trace data collected for the Oracle server in the following applications as shown in Figure 15-1:
You can use information collected with Oracle Trace as an optional source of SQL workload data in Oracle Expert. This SQL data is used when recommending the addition or removal of indexes. Refer to the Oracle Tuning Pack documentation for additional information.
Oracle Trace Data Viewer is a simple viewer for inspecting Oracle Trace collections containing SQL and Wait statistics. You can export Oracle Trace Data to the following products for further analysis:
You can select one or more rows in Data Viewer and save the SQL statement text to a file that you can import into SQL Analyze. You can then use SQL Analyze to tune these individual statements.
SQL in Data Viewer can be saved to a CSV (Comma Separated Value) file for viewing in Microsoft Excel.
You can use Oracle Trace to collect workload data for use in the Oracle Expert application. Oracle Trace collects resource utilization statistics for SQL statements executing against a database in real time. Oracle Trace allows you to collect data about all the SQL statements executing against a database during periods of poor performance.
You control the duration of an Oracle Trace collection period. To obtain SQL workload data for a 15-minute period of poor performance, stop collection immediately after the poor performance interval ends.
While using Data Viewer, you can select one or more rows in the top portion of the Data View window to save to a file. When you choose SQL (SQL Analyze Format) from File/Save, a file containing query text will be saved. You can then import this *.sql file into Oracle SQL Analyze for tuning of the selected statements.
Oracle SQL Analyze can show you the execution plan for individual queries and let you experiment with various optimizer modes and hints.
While using Data Viewer, you can select one or more rows in the top portion of the Data View window to save to a file. When you choose the CSV file format, Oracle Trace creates a *.csv file that you can load into a Microsoft Excel spreadsheet.
Oracle Trace provides a graphical Oracle Trace Manager application to create, schedule, and administer Oracle Trace collections for products containing Oracle Trace calls.
The Oracle server has been coded with Oracle Trace API calls to collect both SQL and Wait statistics with a minimum of overhead. Using the Oracle Trace Manager graphical user interface you can:
Use and control of Oracle Trace revolves around the concept of a "collection." A collection is data collected for events that occurred while an instrumented product was running.
With the Oracle Trace Manager, you can schedule and manage collections. When creating a collection, you define the attributes of the collection, such as the collection name, the products and event sets to be included in the collection, and the start and end times. The Oracle Trace Manager includes a Collection Wizard that facilitates the creation and execution of collections.
Once you create a collection you can execute it immediately or schedule it to execute at a specific time or at specified intervals. When a collection executes, it produces a file containing the event data for the products participating in the collection. You can also use a collection as a template for creating other similar collections.
An event is the occurrence of some activity within a product. Oracle Trace collects data for predefined events occurring within a software product created with the Oracle Trace API. That is, the product is embedded with Oracle Trace API calls. An example of an event is a parse or fetch.
There are two types of events:
Point events represent an instantaneous occurrence of something in the instrumented product. An example of a point event is an error occurrence.
Duration events have a beginning and ending. An example of a duration event is a transaction. Duration events can have other events occur within them; for example, an error can occur within a transaction.
The Oracle server is instrumented for 13 events. Three of these events are:
During a collection, Oracle Trace buffers event data in memory and periodically writes it to a collection binary file. This method ensures low overhead associated with the collection process. You can access event data collected in the binary file by formatting the data to predefined tables which makes the data available for fast, flexible access. These predefined tables are called "Oracle Trace formatter tables."
Oracle Trace Manager provides a mechanism for formatting collection data immediately after a collection or at a later time.
When formatting a collection, you identify the database where Oracle Trace Manager creates the formatted collection as follows:
The collection you select determines which collection definition file and data collection file will be used. The formatted target database determines where the formatted collection data will be stored.
Once the data is formatted, you can access the data using the Data Viewer or by using SQL reporting tools and scripts.
Also, you can access event data by running the Detail report from the Oracle Trace reporting utility. This report provides a basic mechanism for viewing a collection's results. You have limited control over what data is reported and how it is presented.
After using Oracle Trace to collect data, run the Oracle Trace Data Viewer by selecting "View Formatted Data..." from the Oracle Trace Collection menu. Or you can select it directly from the Oracle Diagnostics Pack toolbar. Data Viewer can compute SQL and Wait statistics and resource utilization metrics from the raw data that is collected. Once Data Viewer computes statistics, targeting resource intensive SQL becomes a much simpler task.
Data Viewer computes SQL statistics from data collected by Oracle Trace Manager for all executions of a query during the collection period. Resource utilization during a single execution of a SQL statement may be misleading due to other concurrent activities on the database or node. Combining statistics for all executions may lend a clearer picture about the typical resource utilization occurring when a given query is executed.
SQL and Wait statistics are presented in a comprehensive set of Oracle Trace predefined data views. Within Wait statistics, a data view is the definition of a query into the data collected by Oracle Trace. A data view consists of items or statistics to be returned and optionally a sort order and limit of rows to be returned.
With the data views provided by Data Viewer, you can:
In addition to the predefined data views, you can define your own data views using the Oracle Trace Data View Wizard.
Once Data Viewer has computed SQL and Wait statistics, a dialog box showing the available data views appears. SQL Statistic data views are grouped by I/O, Parse, Elapsed Time, CPU, Row, Sort, and Wait statistics as shown in Figure 15-2. A description of the selected data view is shown on the right-hand side of the screen.
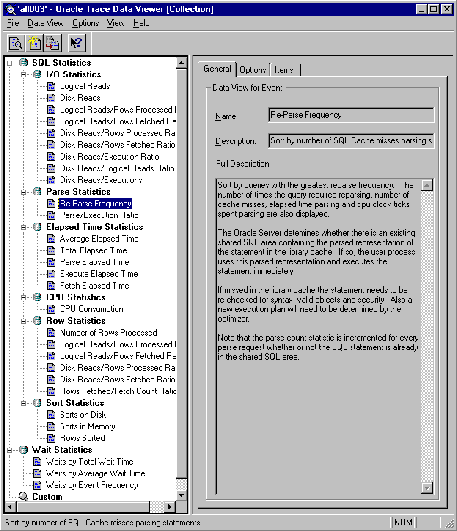
Table 15-1 explains the predefined data views shown in the previous figure as provided by Oracle Trace.
Double clicking on SQL or Wait event data views provided by Data Viewer causes Oracle trace to query the collection data and display data sorted by criteria described in the data view's description.
For example, double clicking the "Disk Reads/Log Reads Ratio" view returns data sorted by queries with the highest data buffer cache miss rate. This also displays the individual disk and logical read values.
Double clicking the "Average Elapsed Time" data view returns data sorted by queries that took the greatest average elapsed time to parse, execute, and fetch. It also displays the average elapsed times for parsing, execution, and fetching.
Figure 15-3 shows data in the "Average Elapsed Time" data view. Query text and statistics appear in the top portion of the window. Clicking any column headers causes the Data Viewer to sort rows by the statistic in that column.
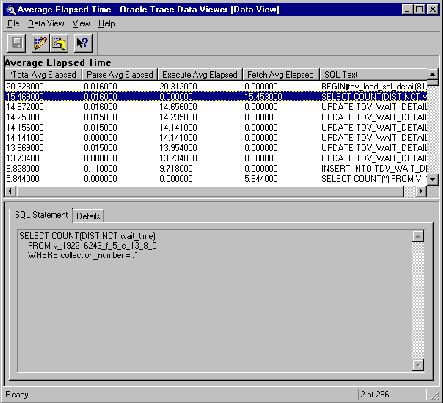
The currently selected data view's SQL text is shown in the lower portion of the window in the SQL Statement property sheet. Full statistical details about the currently selected data view also appear in the Details property sheet.
When examining a data view like that shown in Figure 15-3, you can print the following:
Window focus at the time of printing determines which portion of the screen is printed. For example, if focus is on the top portion of the screen, the tabular form of all statistics and SQL for this data view is printed.
The SQL Statement property page displays the currently selected query in a formatted output.
The Details property page displays a detailed report on statistics for all executions of a given query within an Oracle Trace collection. Text for the currently selected SQL statement is posted at the end of the property page.
Statistics for all parses, executions, and fetches of the SQL statement.
The number of misses in library cache during Parse: 1.000000
Elapsed time statistics for the SQL statement:
   Average Elapsed Time:     0.843000
   Total Elapsed Time:       0.843000

   Total Elapsed Parse:      0.000000
   Total Elapsed Execute:    0.843000
   Total Elapsed Fetch:      0.000000

   Average Elapsed Parse:    0.000000
   Average Elapsed Execute:  0.843000
   Average Elapsed Fetch:    0.000000
Number of times parse, execute and fetch were called:
   Number of Parses:       1
   Number of Executions:   1
   Number of Fetches:      0
Logical I/O statistics for parse, execute and fetch calls:
   Logical I/O for Parses:              1
   Logical I/O for Executions:        247
   Logical I/O for Fetches:             0
   Logical I/O Total:                   0
Disk I/O statistics for parse, execute and fetch calls:
   Disk I/O for Parses:               0
   Disk I/O for Executions:          28
   Disk I/O for Fetches:              0
   Disk I/O Total:                    0
CPU statistics for parse, execute and fetch calls:
   CPU for Parses:               0
   CPU for Executions:       62500
   CPU for Fetches:              0
   CPU Total:                62500
Row statistics for execute and fetch calls:
   Rows processed during Executions:         104
   Rows processed during Fetches:              0
   Rows Total:                               104
Sort statistics for execute and fetch calls:
   Sorts on disk:             0
   Sorts in memory:           2
   Sort rows:               667
Hit Rate - Logical I/O divided by Disk I/O: 0.112903
Logical I/O performed divided by rows actually processed: 2.384615
Disk I/O performed divided by number of executions: 28.000000
The number of parses divided by number of executions: 1.000000
The number of rows fetched divided by the number of fetches: 0.000000
   INSERT INTO tdv_sql_detail
    (collection_number, sql_text_hash,
     "LIB_CACHE_ADDR")
    SELECT DISTINCT collection_number,
                    sql_text_hash,
                    "LIB_CACHE_ADDR"
        FROM v_192216243_f_5_e_7_8_0
        WHERE collection_number = :b1;
There are two convenient ways to obtain additional data for the currently selected SQL statement:
   SELECT COUNT(DISTINCT WAIT_TIME)
   FROM v_192216243_f_5_e_13_8_0
   WHERE collection_number = :1;
This query counts distinct values in the WAIT_TIME column of the
v_192216243_f_5_e_13_8_0 table. By modifying the existing data view, you can add other statistics that may be of interest such as "Sort Rows", which is the number of rows sorted, or "Execute CPU", which is the number of CPU clock ticks during execution.
This query counts distinct values in the WAIT_TIME column of the WAITS table. By modifying the existing data view you can add other statistics that may be of interest such as "Execute Rows", which is the number of rows processed during execution, or "Execute CPU", which is the number of CPU clock ticks during execution.
You can also remove existing columns, change the sort order, or change the default number of rows to view. You can save a modified view to a new, user-defined data view. Oracle stores user-defined data views in the Custom data view container following the Data Viewer supplied list of SQL and Wait data views.
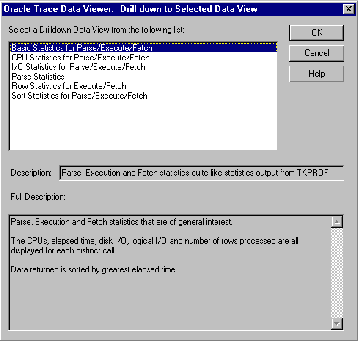
Drill-down data views show individual statistics for all parses, executions, and fetches.
In Figure 15-4 the "Basic Statistics for Parse/Execute/Fetch" drill-down data view is selected. It displays statistics similar to those from TKPROF.
Though the Oracle Trace Manager is the primary interface to Oracle Trace, you can optionally force a manual collection of Oracle Trace data. You can do this by using a command-line interface, editing initialization parameters, or by executing stored procedures.
Another option for controlling Oracle Trace server collections is the Oracle Trace CLI (Command-line Interface). The CLI collects event data for all server sessions attached to the database at collection start time. Sessions that attach after the collection is started are excluded from the collection. The CLI is invoked by the OTRCCOL command for the following functions:
The parameter JOB_ID can be any numeric value but must be unique and you must remember this value to stop the collection. The input parameter file contains specific parameter values required for each function as shown in the following examples. COL_NAME (collection name) and CDF_FILE (collection definition file) are initially defined in the START function input parameter file.
The OTRCCOL START command invokes a collection based upon parameter values contained in the input parameter file. For example:
OTRCCOL START 1234 my_start_input_file
Where file MY_START_INPUT_FILE contains the following input parameters:
|
col_name |
my_collection |
|
dat_file |
<usually same as collection name>.dat |
|
cdf_file |
<usually same as collection name>.cdf |
|
fdf_file |
<server event set>.fdf |
|
regid |
1 192216243 0 0 5 <database SID> |
The server event sets that can be used as values for the fdf_file are ORACLE, ORACLEC, ORACLED, ORACLEE, and ORACLESM.
|
See Also:
"Using Initialization Parameters to Control Oracle Trace" for more information on the server event sets. |
The OTRCCOL STOP command halts a running collection as follows:
OTRCCOL STOP 1234 my_stop_input_file
Where my_stop_input_file contains the collection name and cdf_file name.
The OTRCCOL FORMAT command formats the binary collection file to Oracle tables. An example of the FORMAT command is:
otrccol format my_format_input_file
Where my_format_input_file contains the following input parameters:
|
username |
<database username> |
|
password |
<database password> |
|
service |
<database service name> |
|
cdf_file |
<usually same as collection name>.cdf |
|
full_format |
<0/1> |
A full_format value of 1 produces a full format; a value of 0 produces a partial format.
|
See Also:
"Formatting Oracle Trace Data to Oracle Tables" for information on formatting part or all of an Oracle Trace collection and for other important information on creating the Oracle Trace formatting tables prior to running the format command. |
The OTRCCOL DCF command deletes collection files for a specific collection. The OTRCCOL DFD command deletes formatted data from the Oracle Trace formatter tables for a specific collection.
Six parameters are set up by default to control Oracle Trace. By logging into the administrator account in your database and executing the SHOW PARAMETERS TRACE command, you will see the following parameters as shown in Table 15-3:
You can modify the Oracle Trace initialization parameters and use them by adding them to your initialization file.
The ORACLE_TRACE_ENABLE parameter is set to FALSE by default. A value of FALSE disables any use of Oracle Trace for that Oracle server.
To enable Oracle Trace collections for the server, set the parameter to TRUE. Having the parameter set to TRUE does not start an Oracle Trace collection, but instead allows Oracle Trace to be used for that server. You can then start Oracle Trace in one of the following ways:
When ORACLE_TRACE_ENABLE is set to TRUE, you can start and stop an Oracle Trace server collection by either using the Oracle Trace Manager application that is supplied with the Oracle Diagnostics Pack, or you can enter a collection name in the ORACLE_TRACE_COLLECTION_NAME parameter. The default value for this parameter is NULL. A collection name can be up to 16 characters in length. You must then shut down your database and start it up again to activate the parameters. If a collection name is specified, when you start the server, you automatically start an Oracle Trace collection for all database sessions, which is similar in functionality to SQL Trace.
To stop the collection that was started using the ORACLE_TRACE_COLLECTION_NAME parameter, shut down the server instance and reset the ORACLE_TRACE_COLLECTION_NAME to NULL. The collection name specified in this value is also used in two collection output file names: the collection definition file (collection_name.cdf) and the binary data file (collection_name.dat).
The ORACLE_TRACE_FACILITY_NAME initialization parameter specifies the event set that Oracle Trace collects. The name of the DEFAULT event set is ORACLED. The ALL event set is ORACLE, the EXPERT event set is ORACLEE, the SUMMARY event set is ORACLESM, and the CACHEIO event set is ORACLEC.
If once restarted, the database does not begin collecting data, check the following:
find . -name EPC_ERROR.LOG -print .
Using the Oracle Trace stored procedures you can invoke an Oracle Trace collection for your own session or for another session. To collect Oracle Trace data for your own database session, execute the following stored procedure package syntax:
   DBMS_ORACLE_TRACE_USER.SET_ORACLE_TRACE(TRUE/FALSE,
   collection_name, serverevent_set)
where:
Example:
EXECUTE DBMS_ORACLE_TRACE_USER.SET_ORACLE_TRACE (TRUE,'MYCOLL','oracle');
To collect Oracle Trace data for a database session other than your own, execute the following stored procedure package syntax:
   DBMS_ORACLE_TRACE_AGENT.SET_ORACLE_TRACE_IN_SESSION
   (sid, serial#, true/false, collection_name, server_event_set)
where:
|
sid |
Number: session instance from V$SESSION.SID. |
|
serial# |
Number: session serial number from V$SESSION.SERIAL#. |
Example:
   EXECUTE DBMS_ORACLE_TRACE_AGENT.SET_ORACLE_TRACE_IN_SESSION
   (8,12,TRUE,'NEWCOLL','oracled');
If the collection does not occur, check the following:
Running an Oracle Trace collection produces the following collection files:
You can access the Oracle Trace data in the collection files in the following ways:
You can format Oracle Trace server collection Oracle tables for more flexible access SQL reporting tools. Oracle Trace produces a separate table for each event collected. For example, a parse event table is created to store data for all parse events occurring during a server collection. Before you can format data, you must first set up the Oracle Trace formatter tables by executing the OTRCFMTC.SQL script on the server host machine.
Use the following syntax to format an Oracle Trace collection:
OTRCFMT [optional parameters] collection_name.cdf [user/password@database]
If you omit user/password@database, Oracle prompts you for this information.
Oracle Trace allows data to be formatted while a collection is occurring. By default, Oracle Trace formats only the portion of the collection that has not been formatted previously. If you want to reformat the entire collection file, use the optional parameter -f.
Oracle Trace provides several SQL scripts that you can use to access the server event tables. For more information on server event tables and scripts for accessing event data and improving event table performance, refer to the Oracle Trace User's Guide.
The Oracle Trace statistics reporting utility displays statistics for all items associated with each occurrence of a server event. These reports can be quite large. You can control the report output by using command parameters. Use the following command and optional parameters to produce a report:
OTRCREP [optional parameters] collection_name.CDF
First, you may want to run a report called "PROCESS.txt". You can produce this report to provide a listing of specific process identifiers for which you want to run another report.
You can manipulate the output of the Oracle Trace reporting utility by using the following optional report parameters:
| output_path | Specifies a full output path for the report files. If not specified, the files will be placed in the current directory. |
| -p | Organizes event data by process. If you specify a process ID (pid), you will have one file with all the events generated by that process in chronological order. If you omit the process ID, you will have one file for each process that participated in the collection. The output files are named collection_Ppid.txt. |
| -P | Produces a report called collection_PROCESS.txt that lists all processes that participated in the collection. It does not include event data. You could produce this report first to determine the specific processes for which you might want to produce more detailed reports. |
| -w# | Sets report width, such as -w132. The default is 80 characters. |
| -l# | Sets the number of report lines per page. The default is 63 lines per page. |
| -h | Suppresses all event and item report headers, producing a shorter report. |
| -s | Used with Net8 data only. This option creates a file similar to the SQLNet Tracing file. |
| -a | Creates a report containing all the events for all products, in the order they occur in the data collection (.dat) file. |