Quantitative Visualization For Large-Magnitude-Range Vector Fields
Validation of SplitVectors Encoding for Quantitative Visualization of Large-Magnitude-Range Vector Fields.
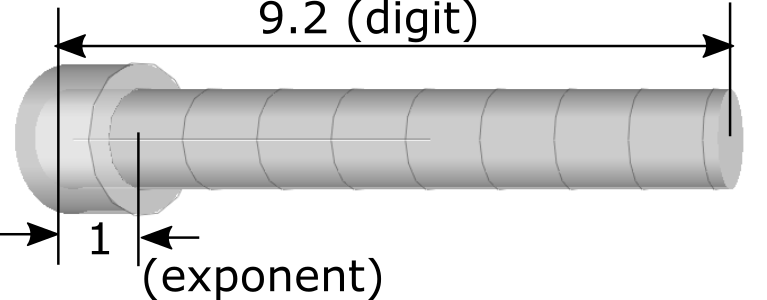
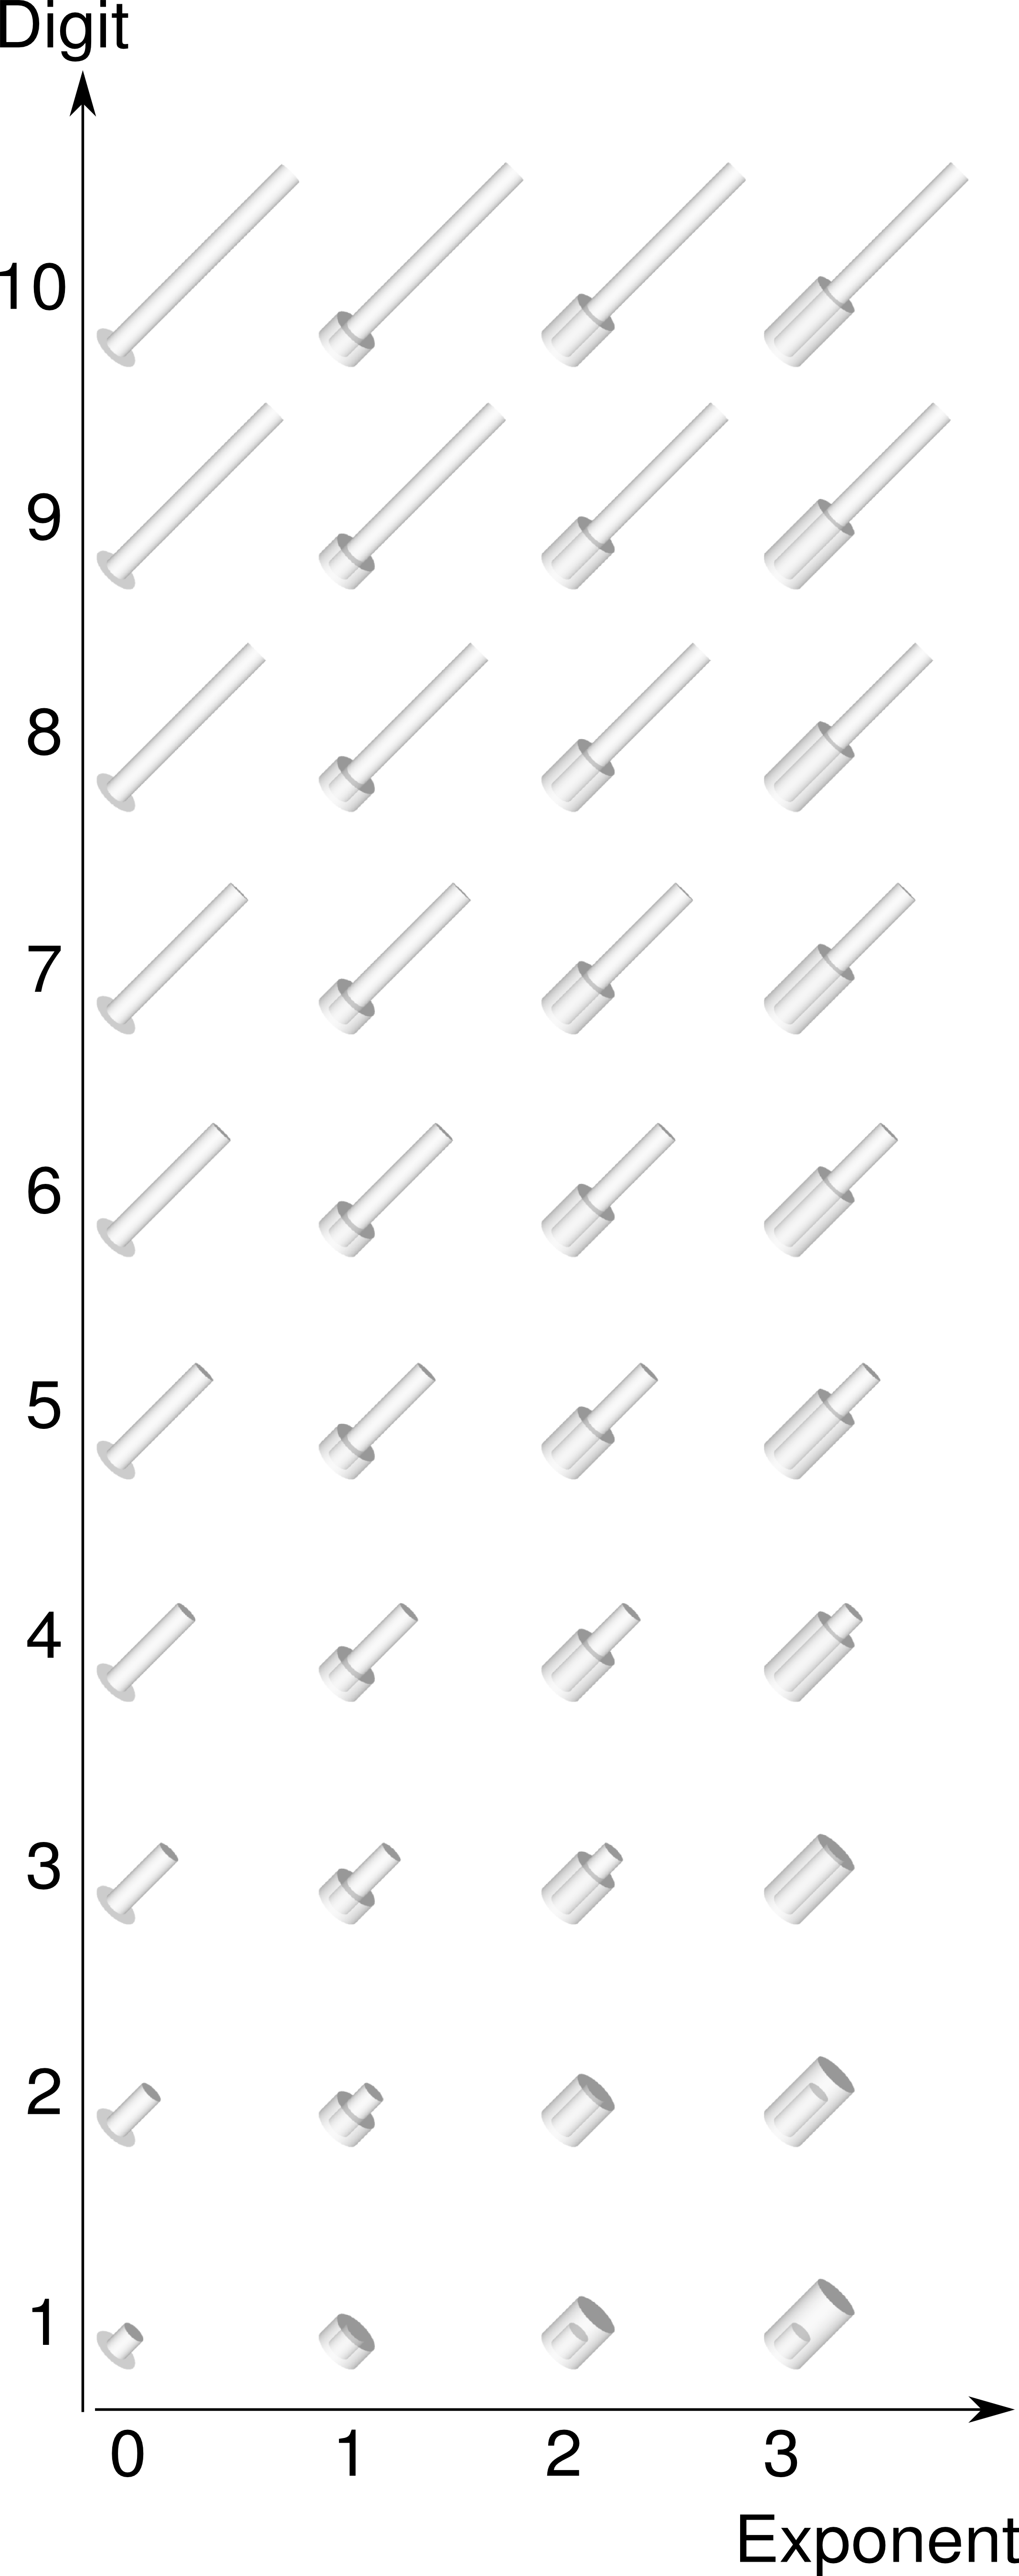
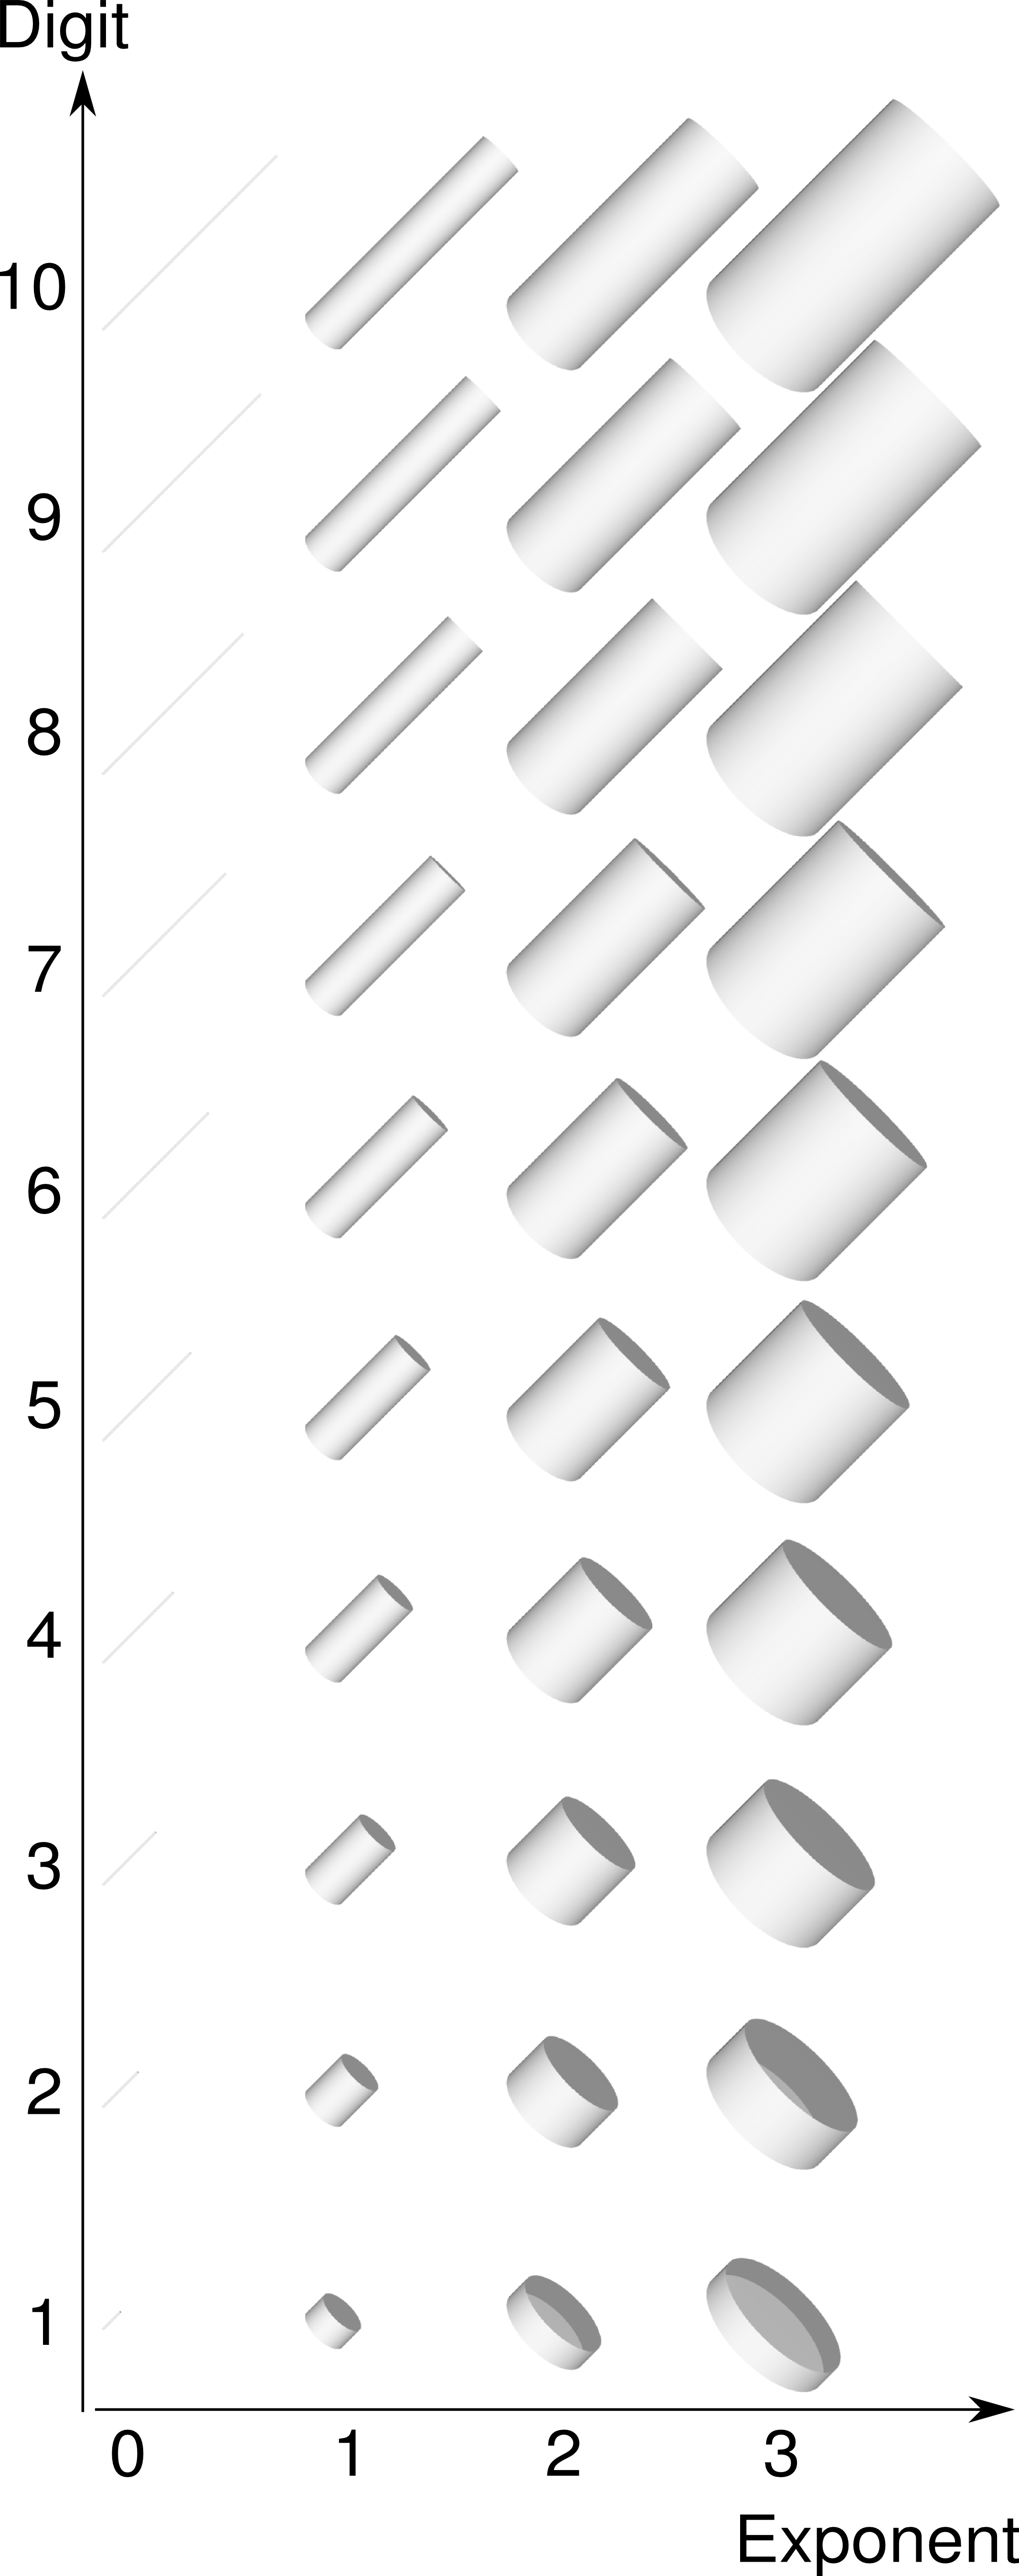
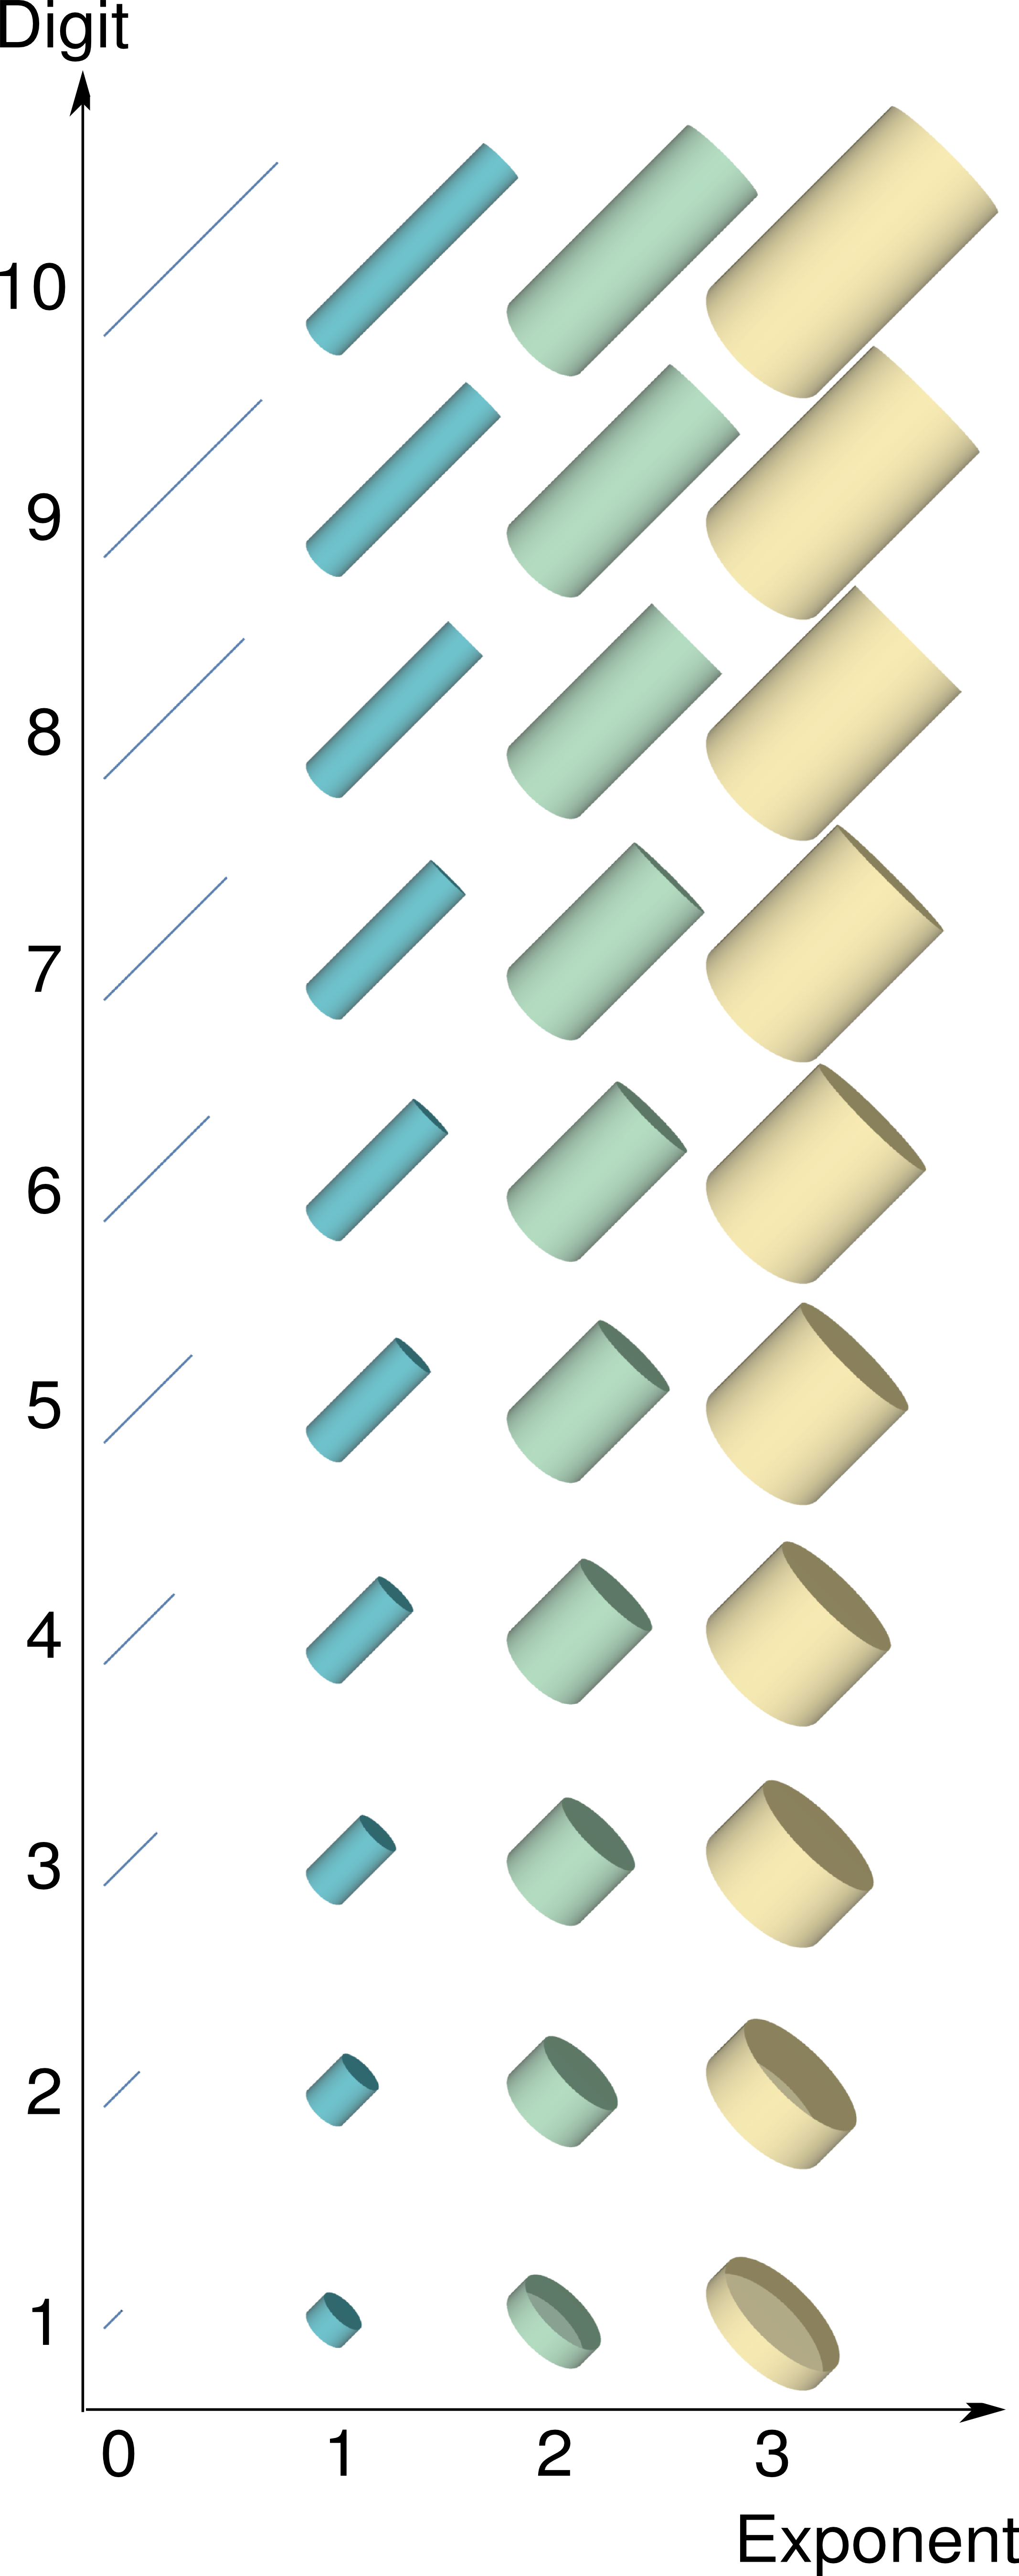
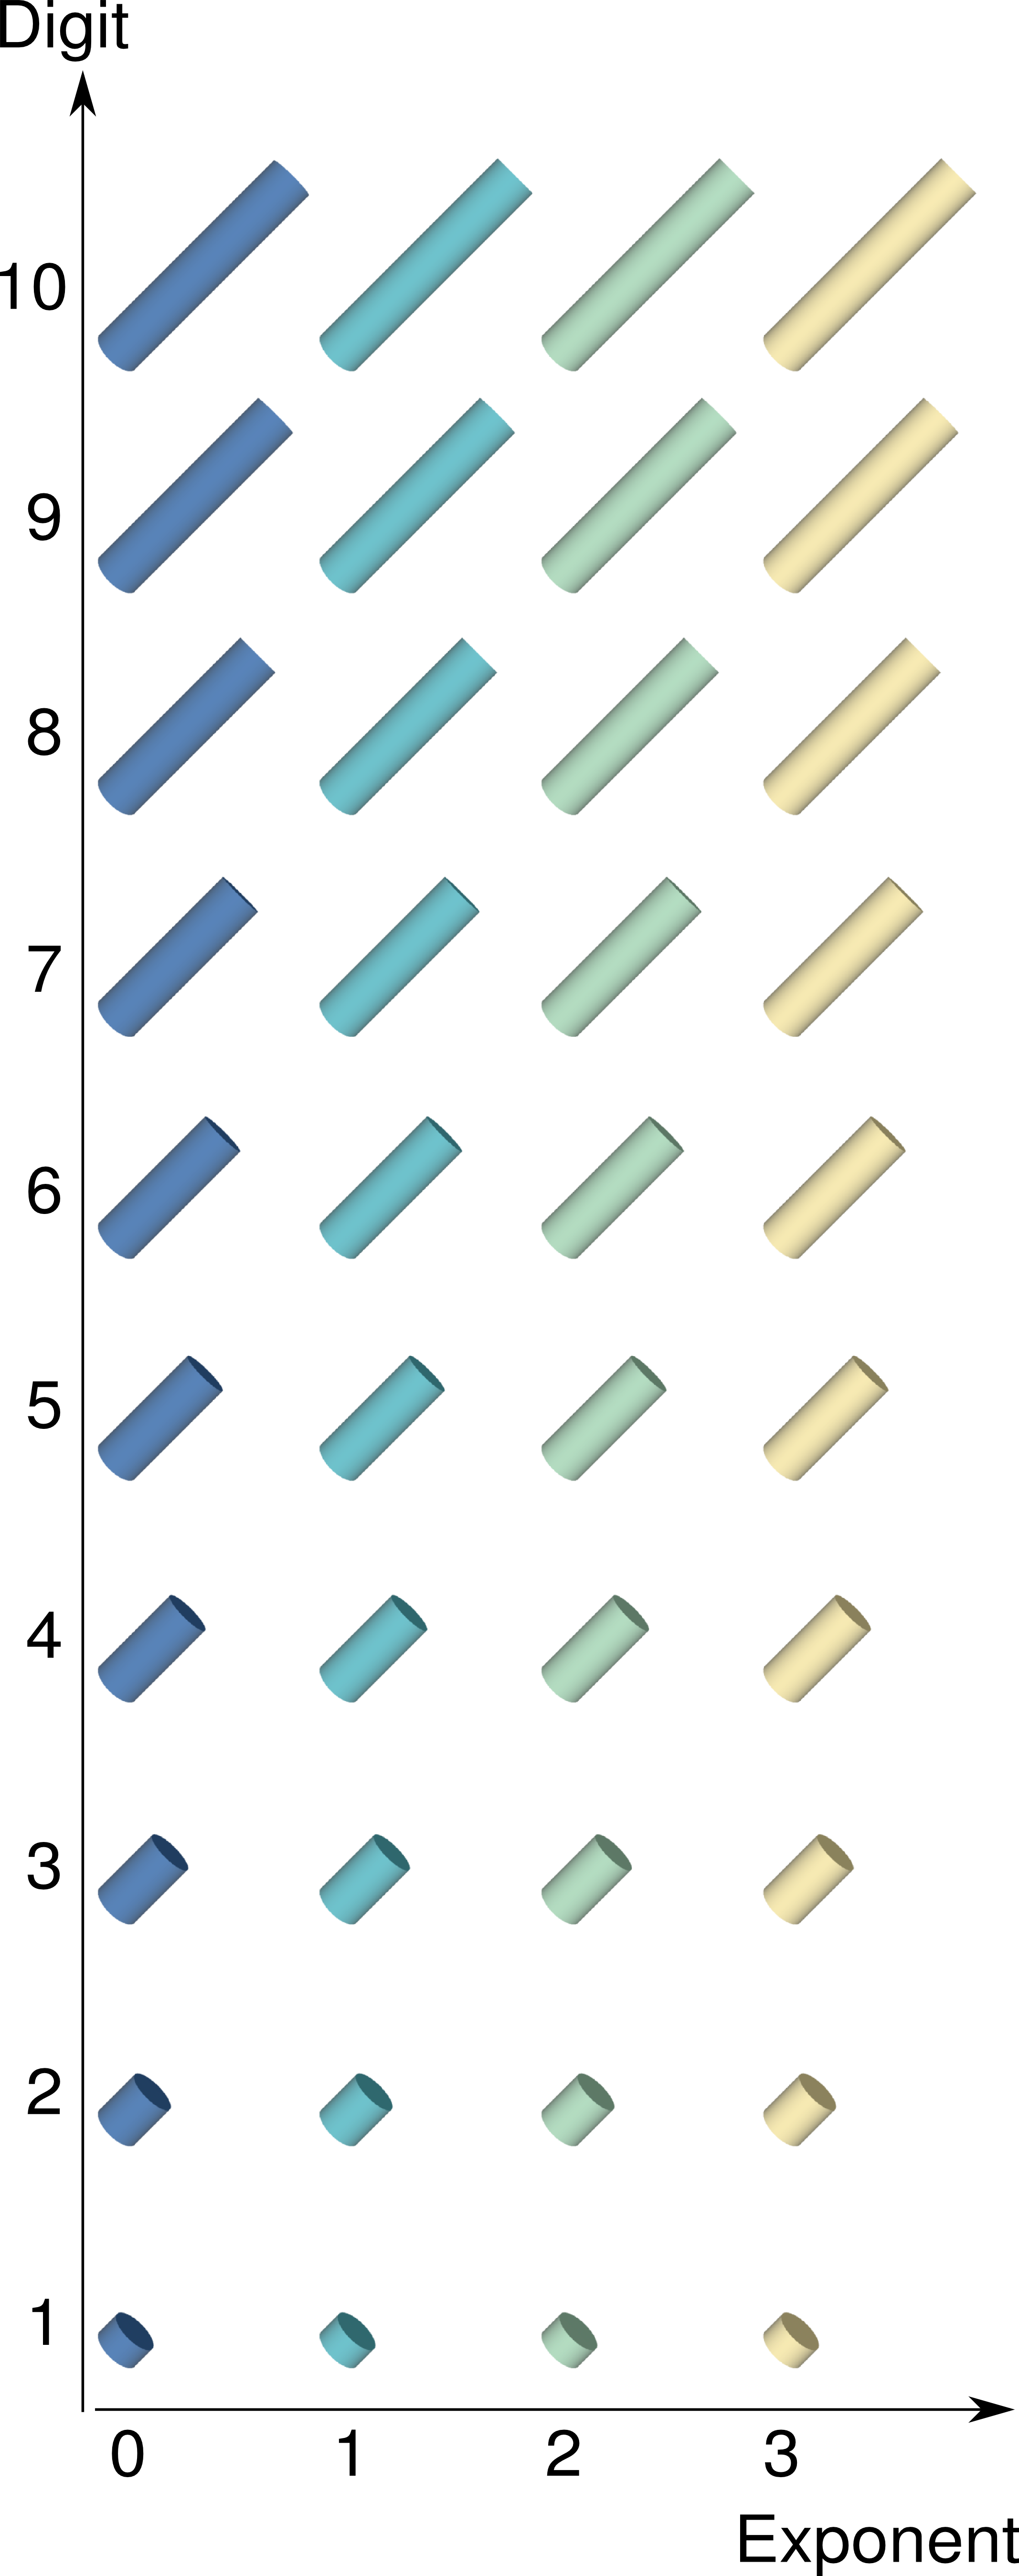
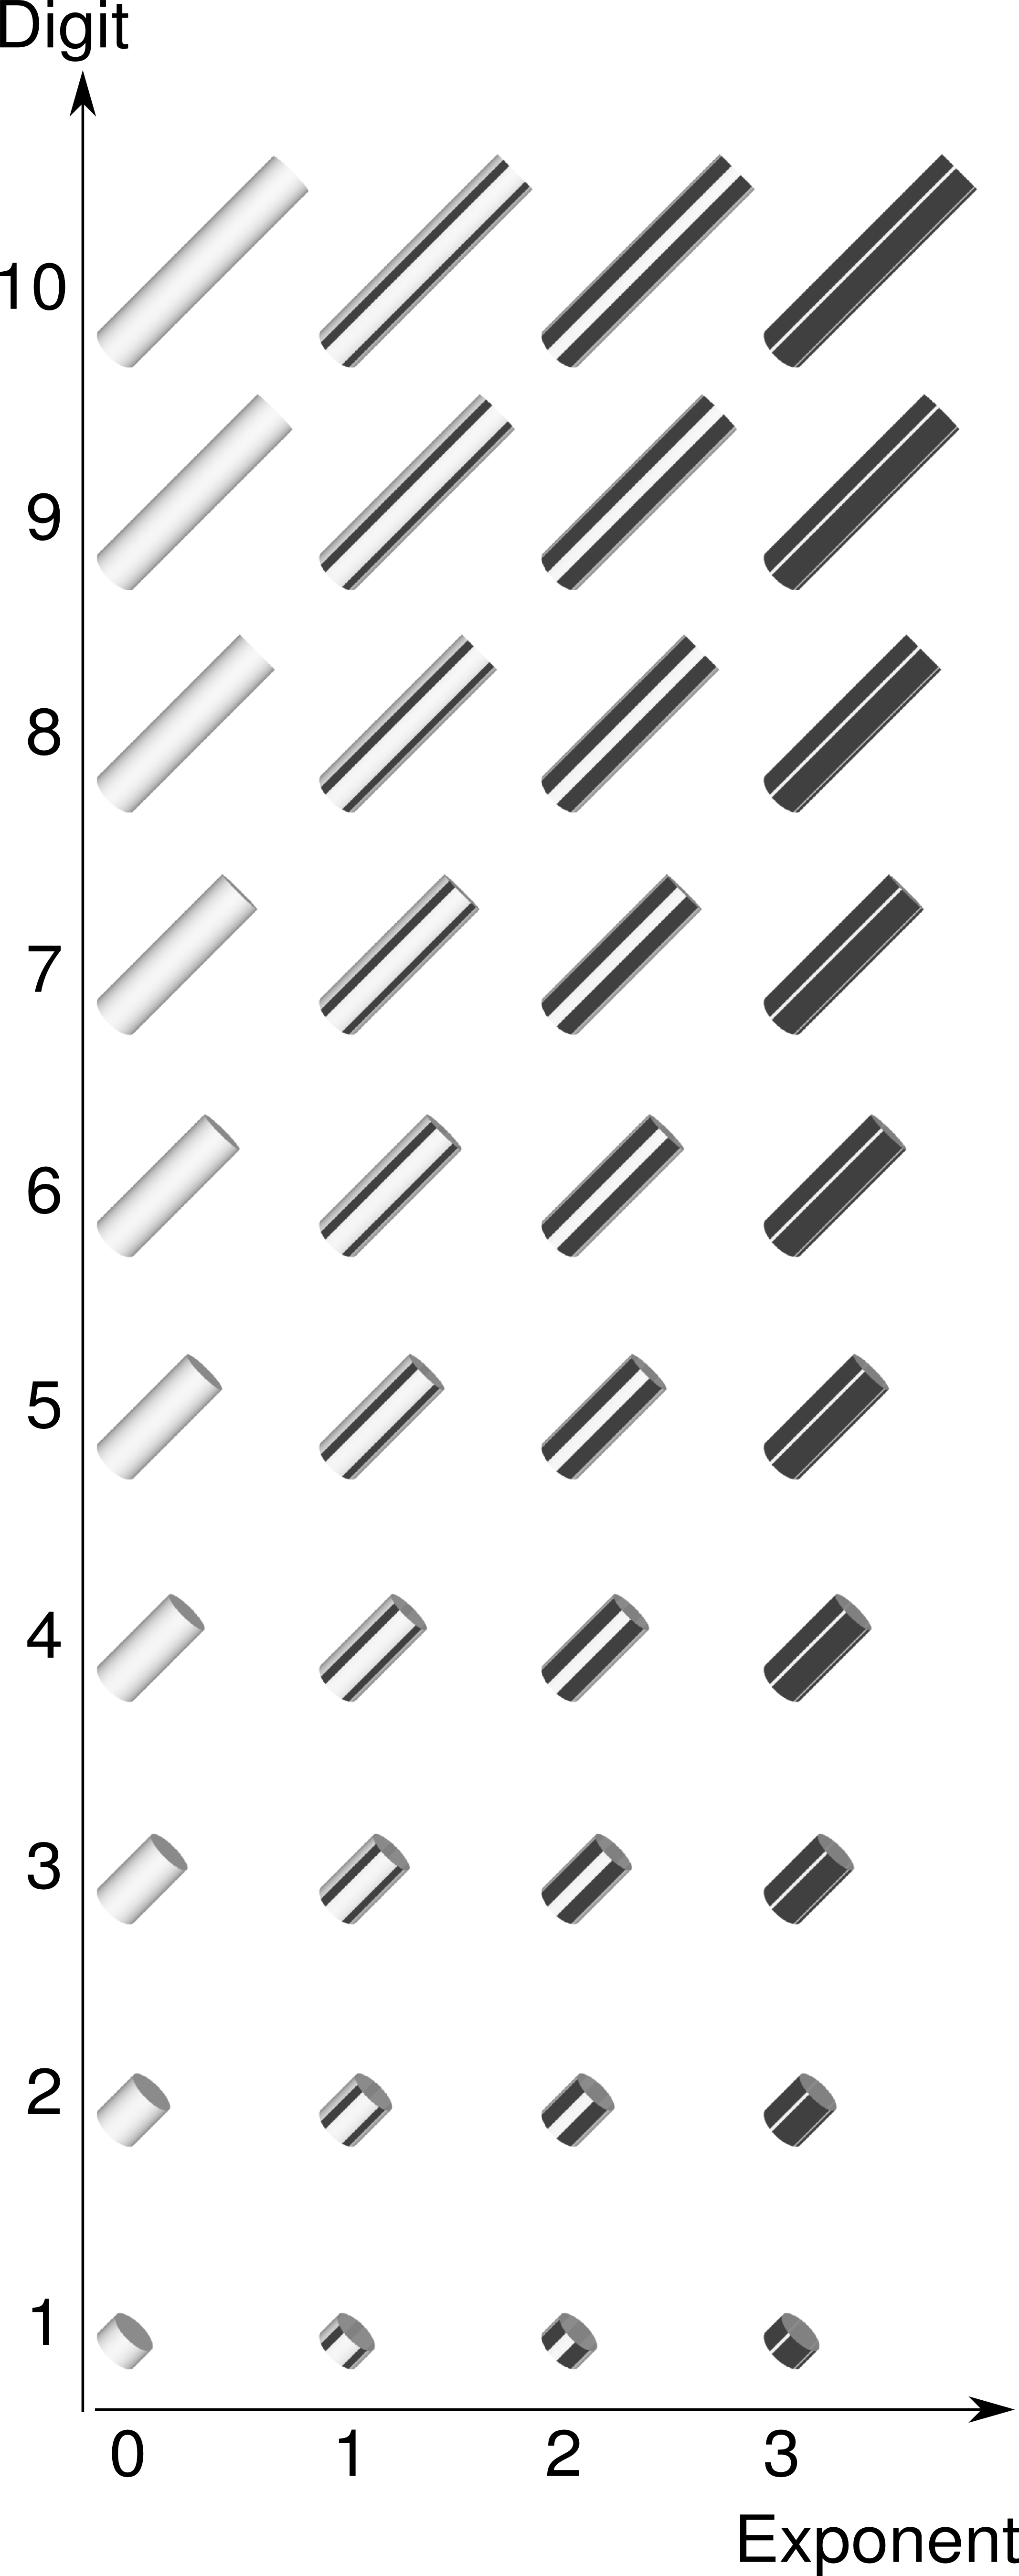
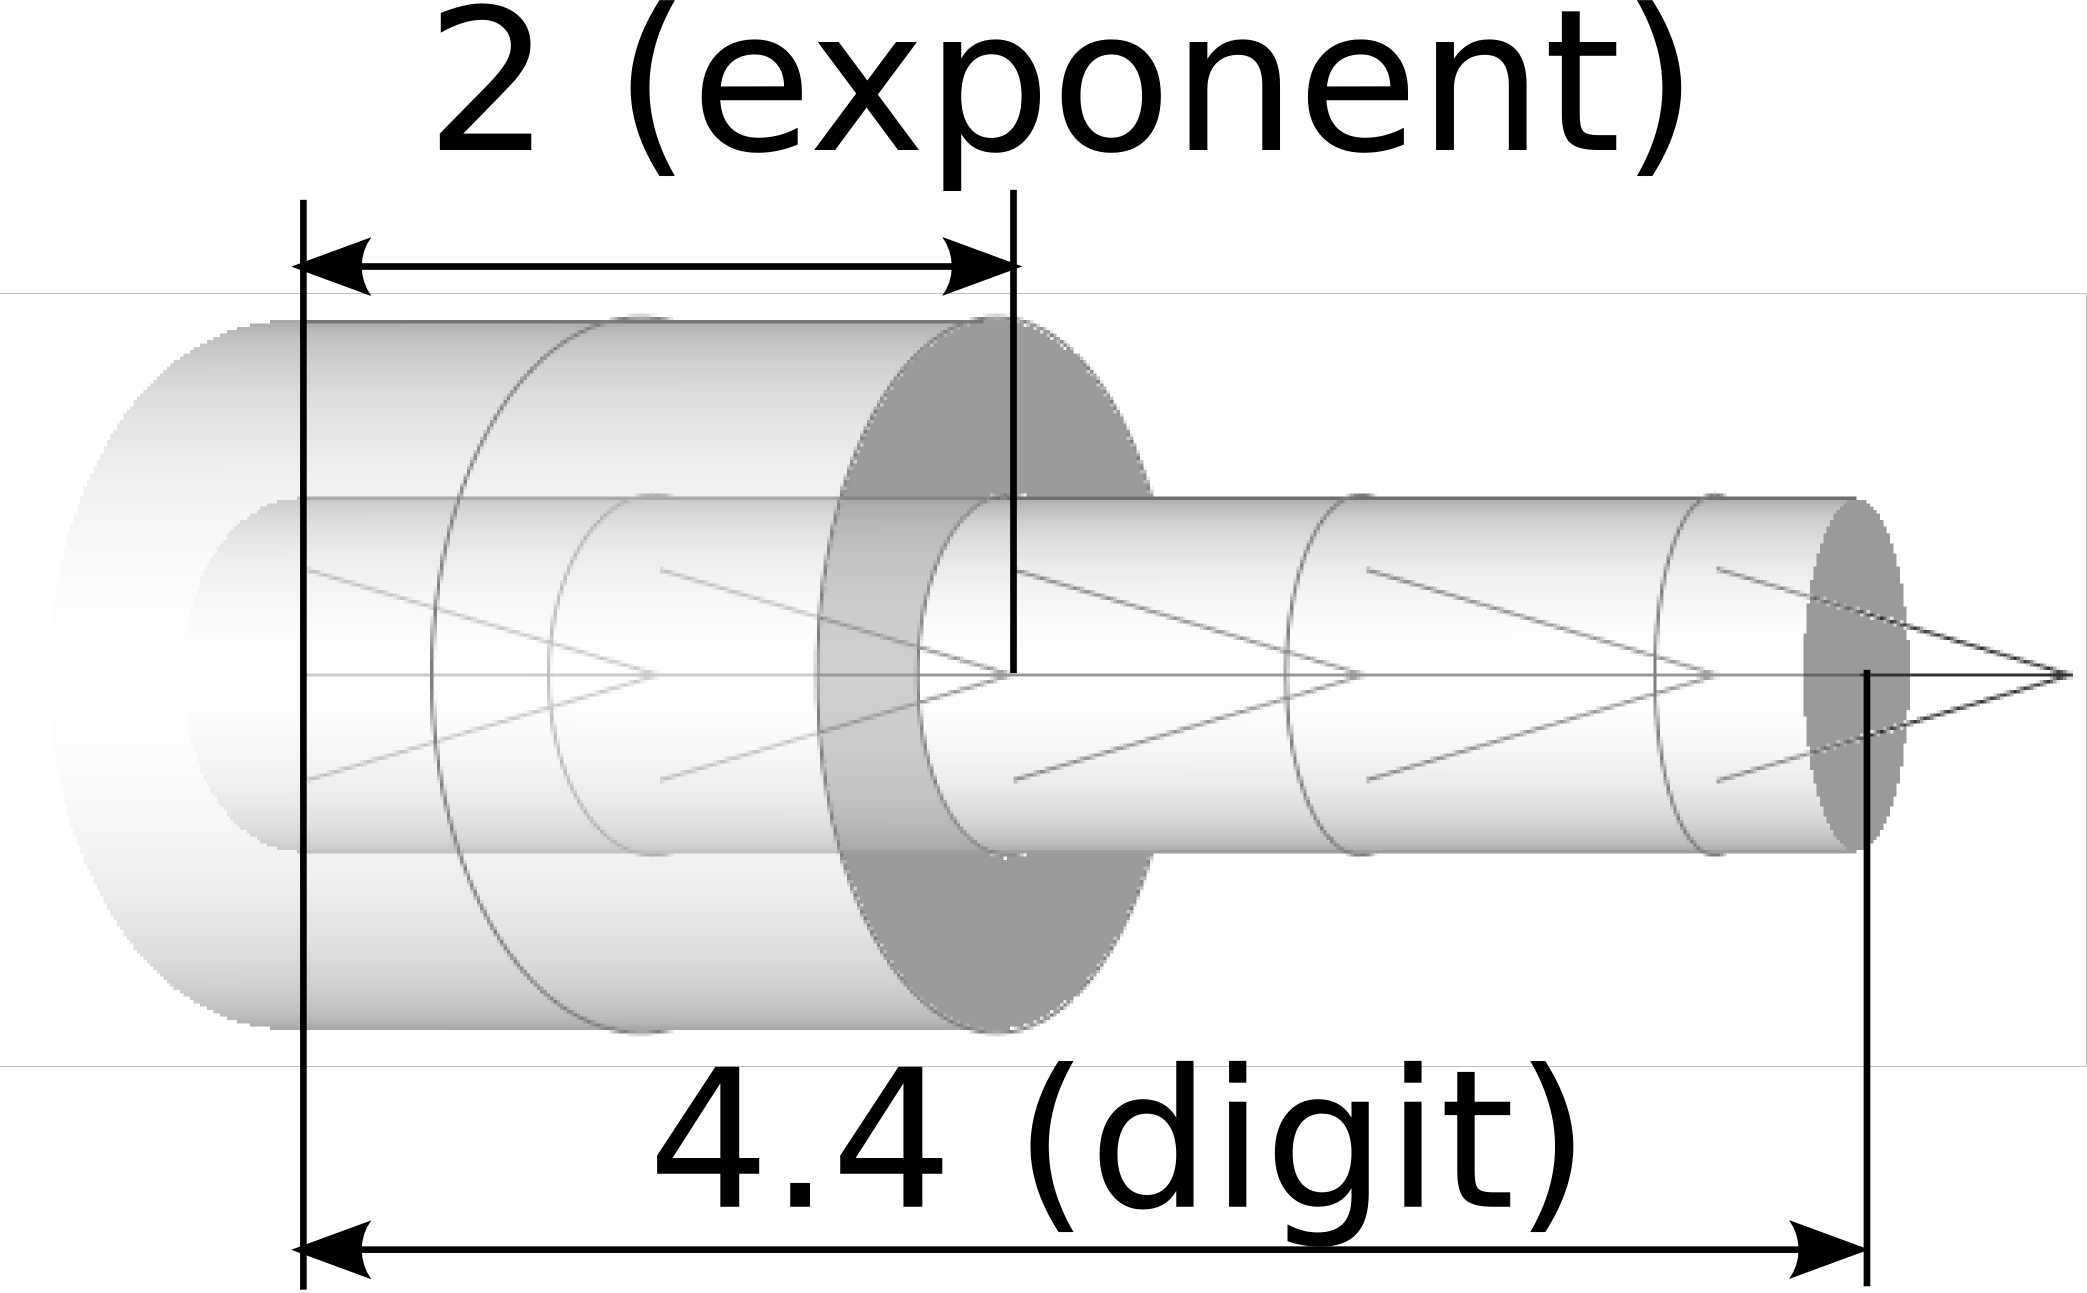
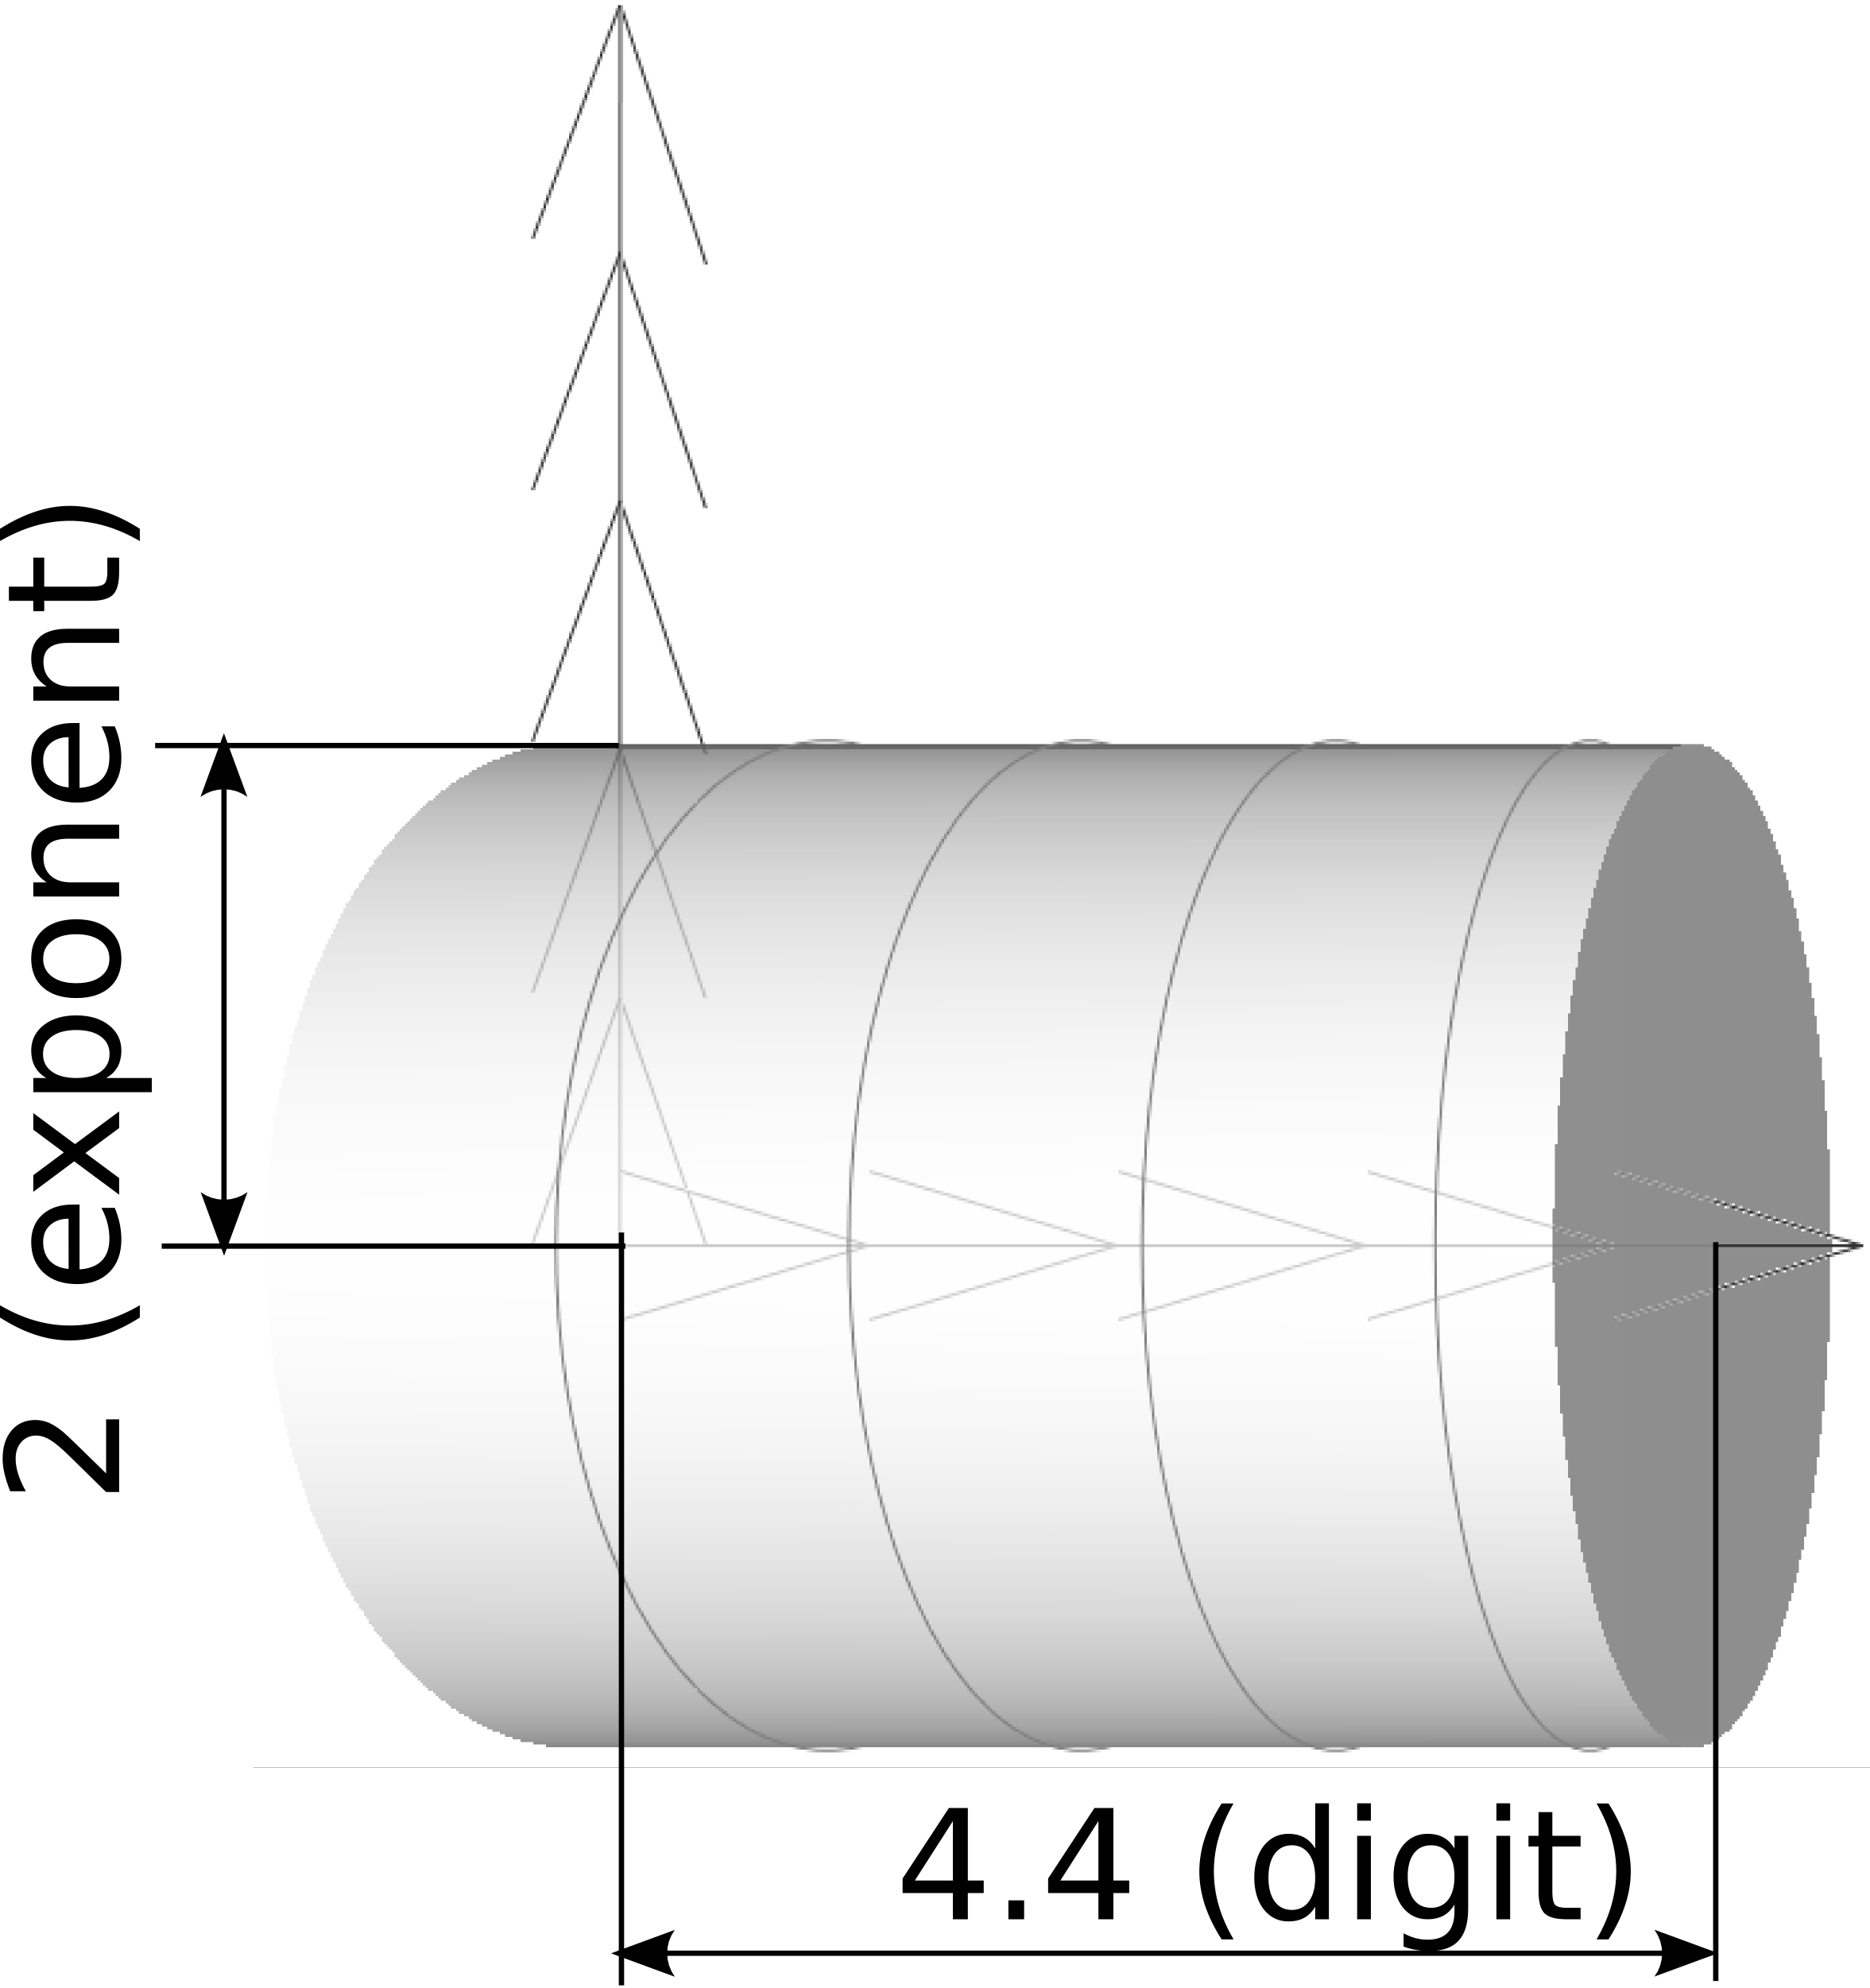
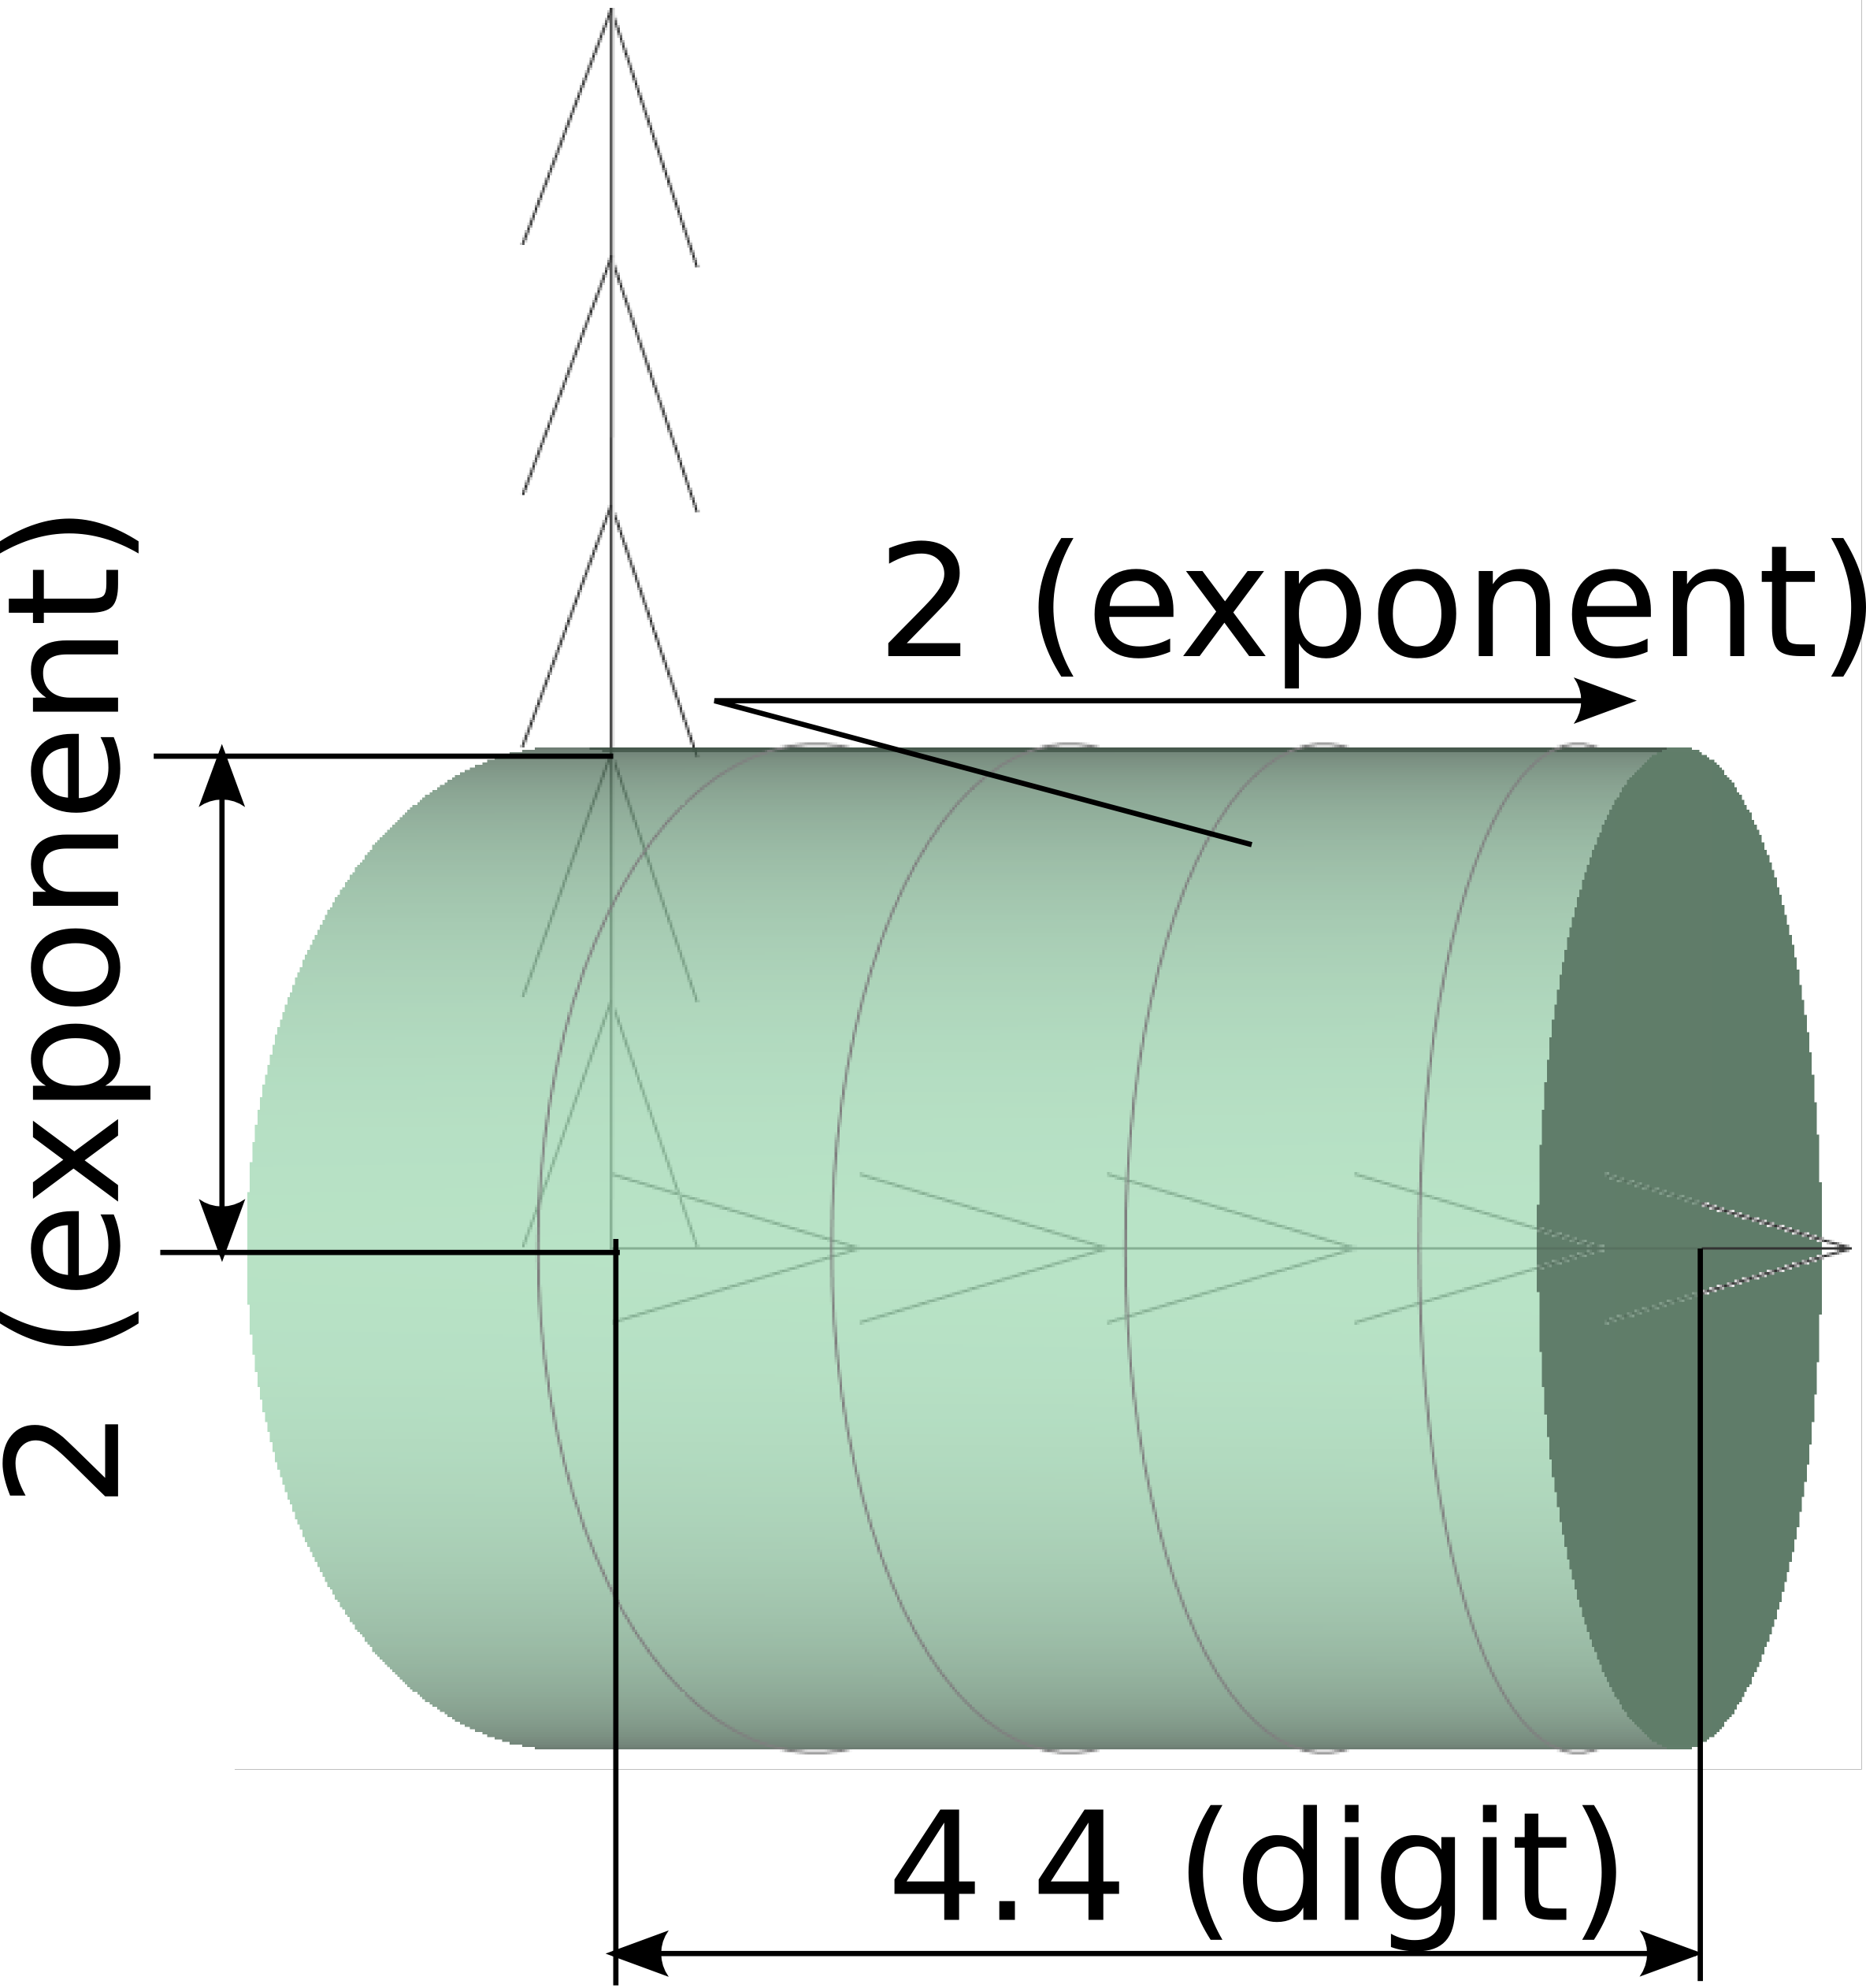
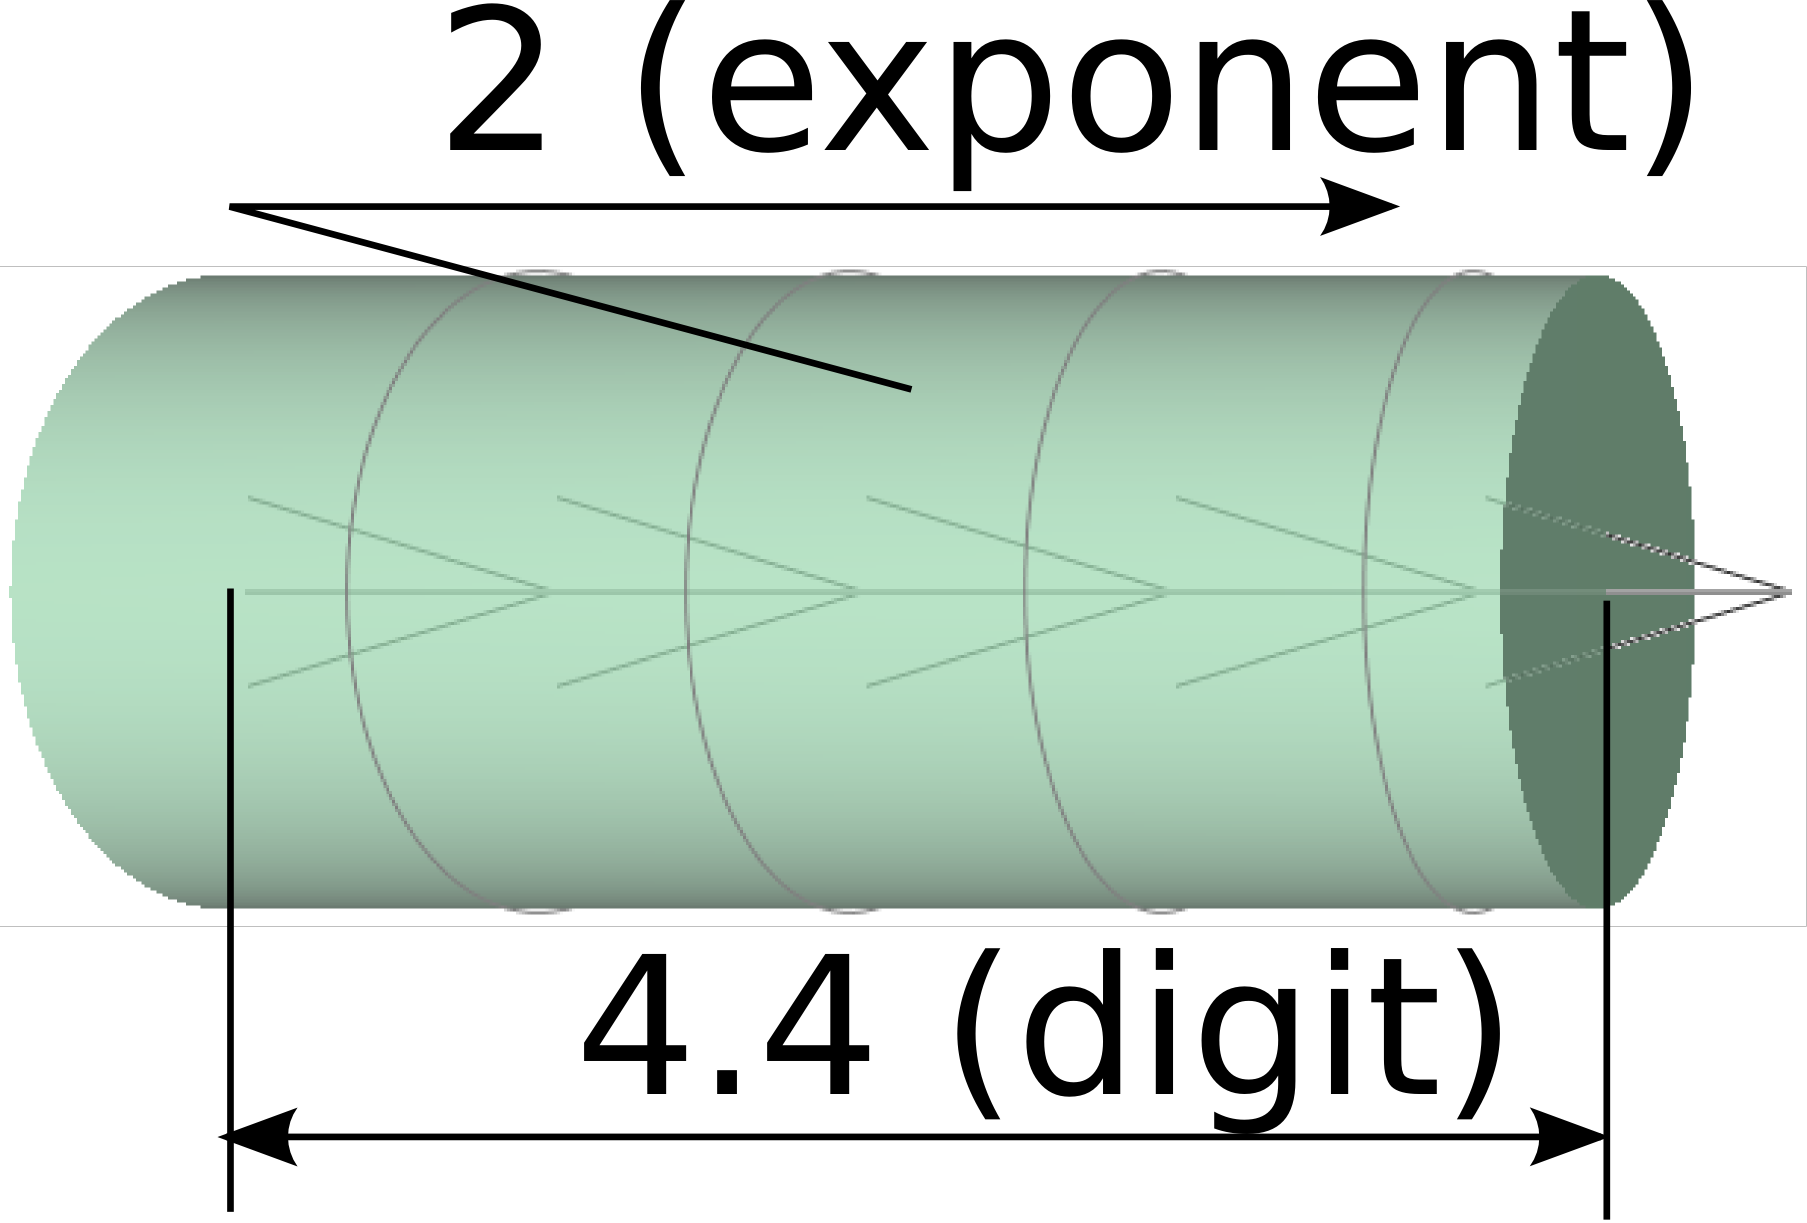
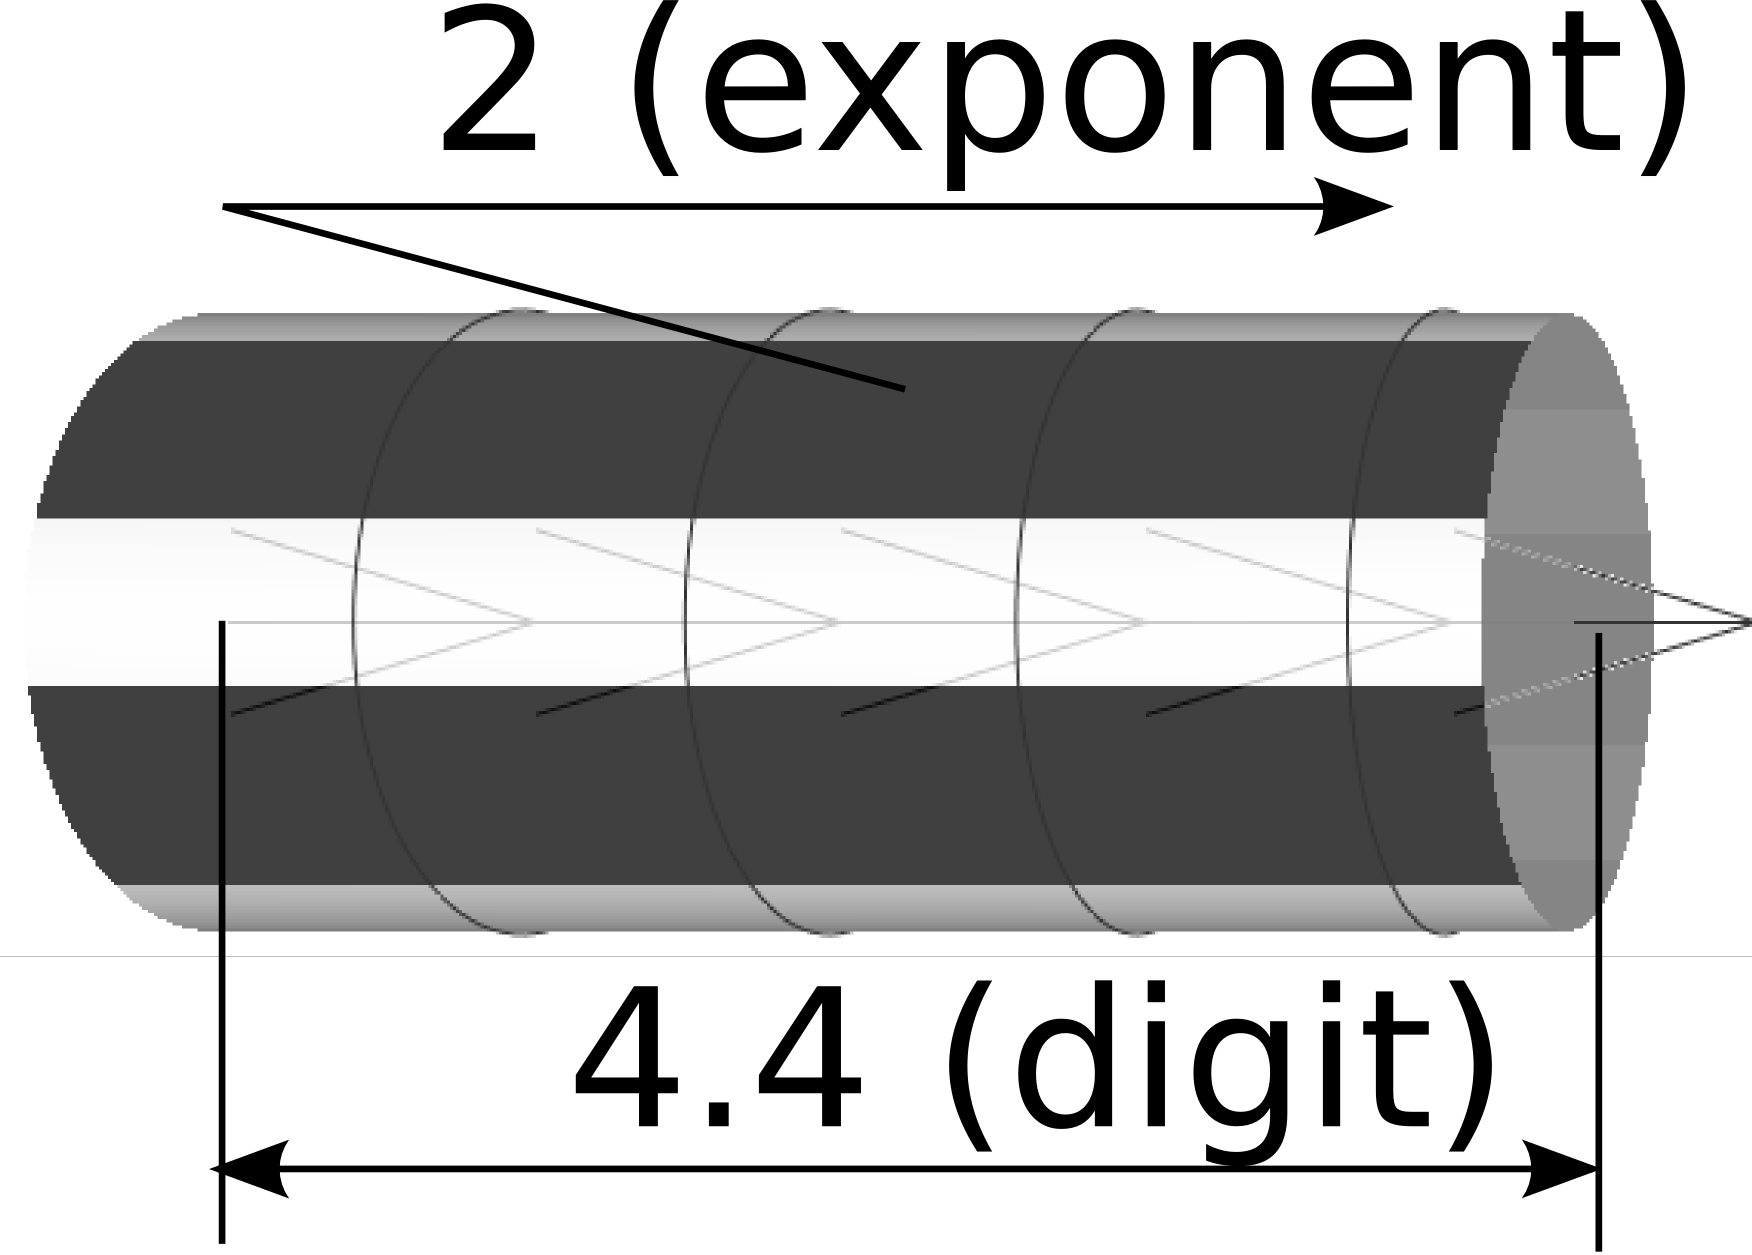
We designed and evaluated SplitVectors, a new vector field display approach on large-magnitude-range scientific data shown in three-dimensional (3D) visualization environments. SplitVectors uses scientific notation to display vector magnitude: digits and exponents are represented by two visual variables, such as length.
Figure 1: An example of SplitVectors
Figure 2: The same dataset represented by linear, log, SplitVectors, and text
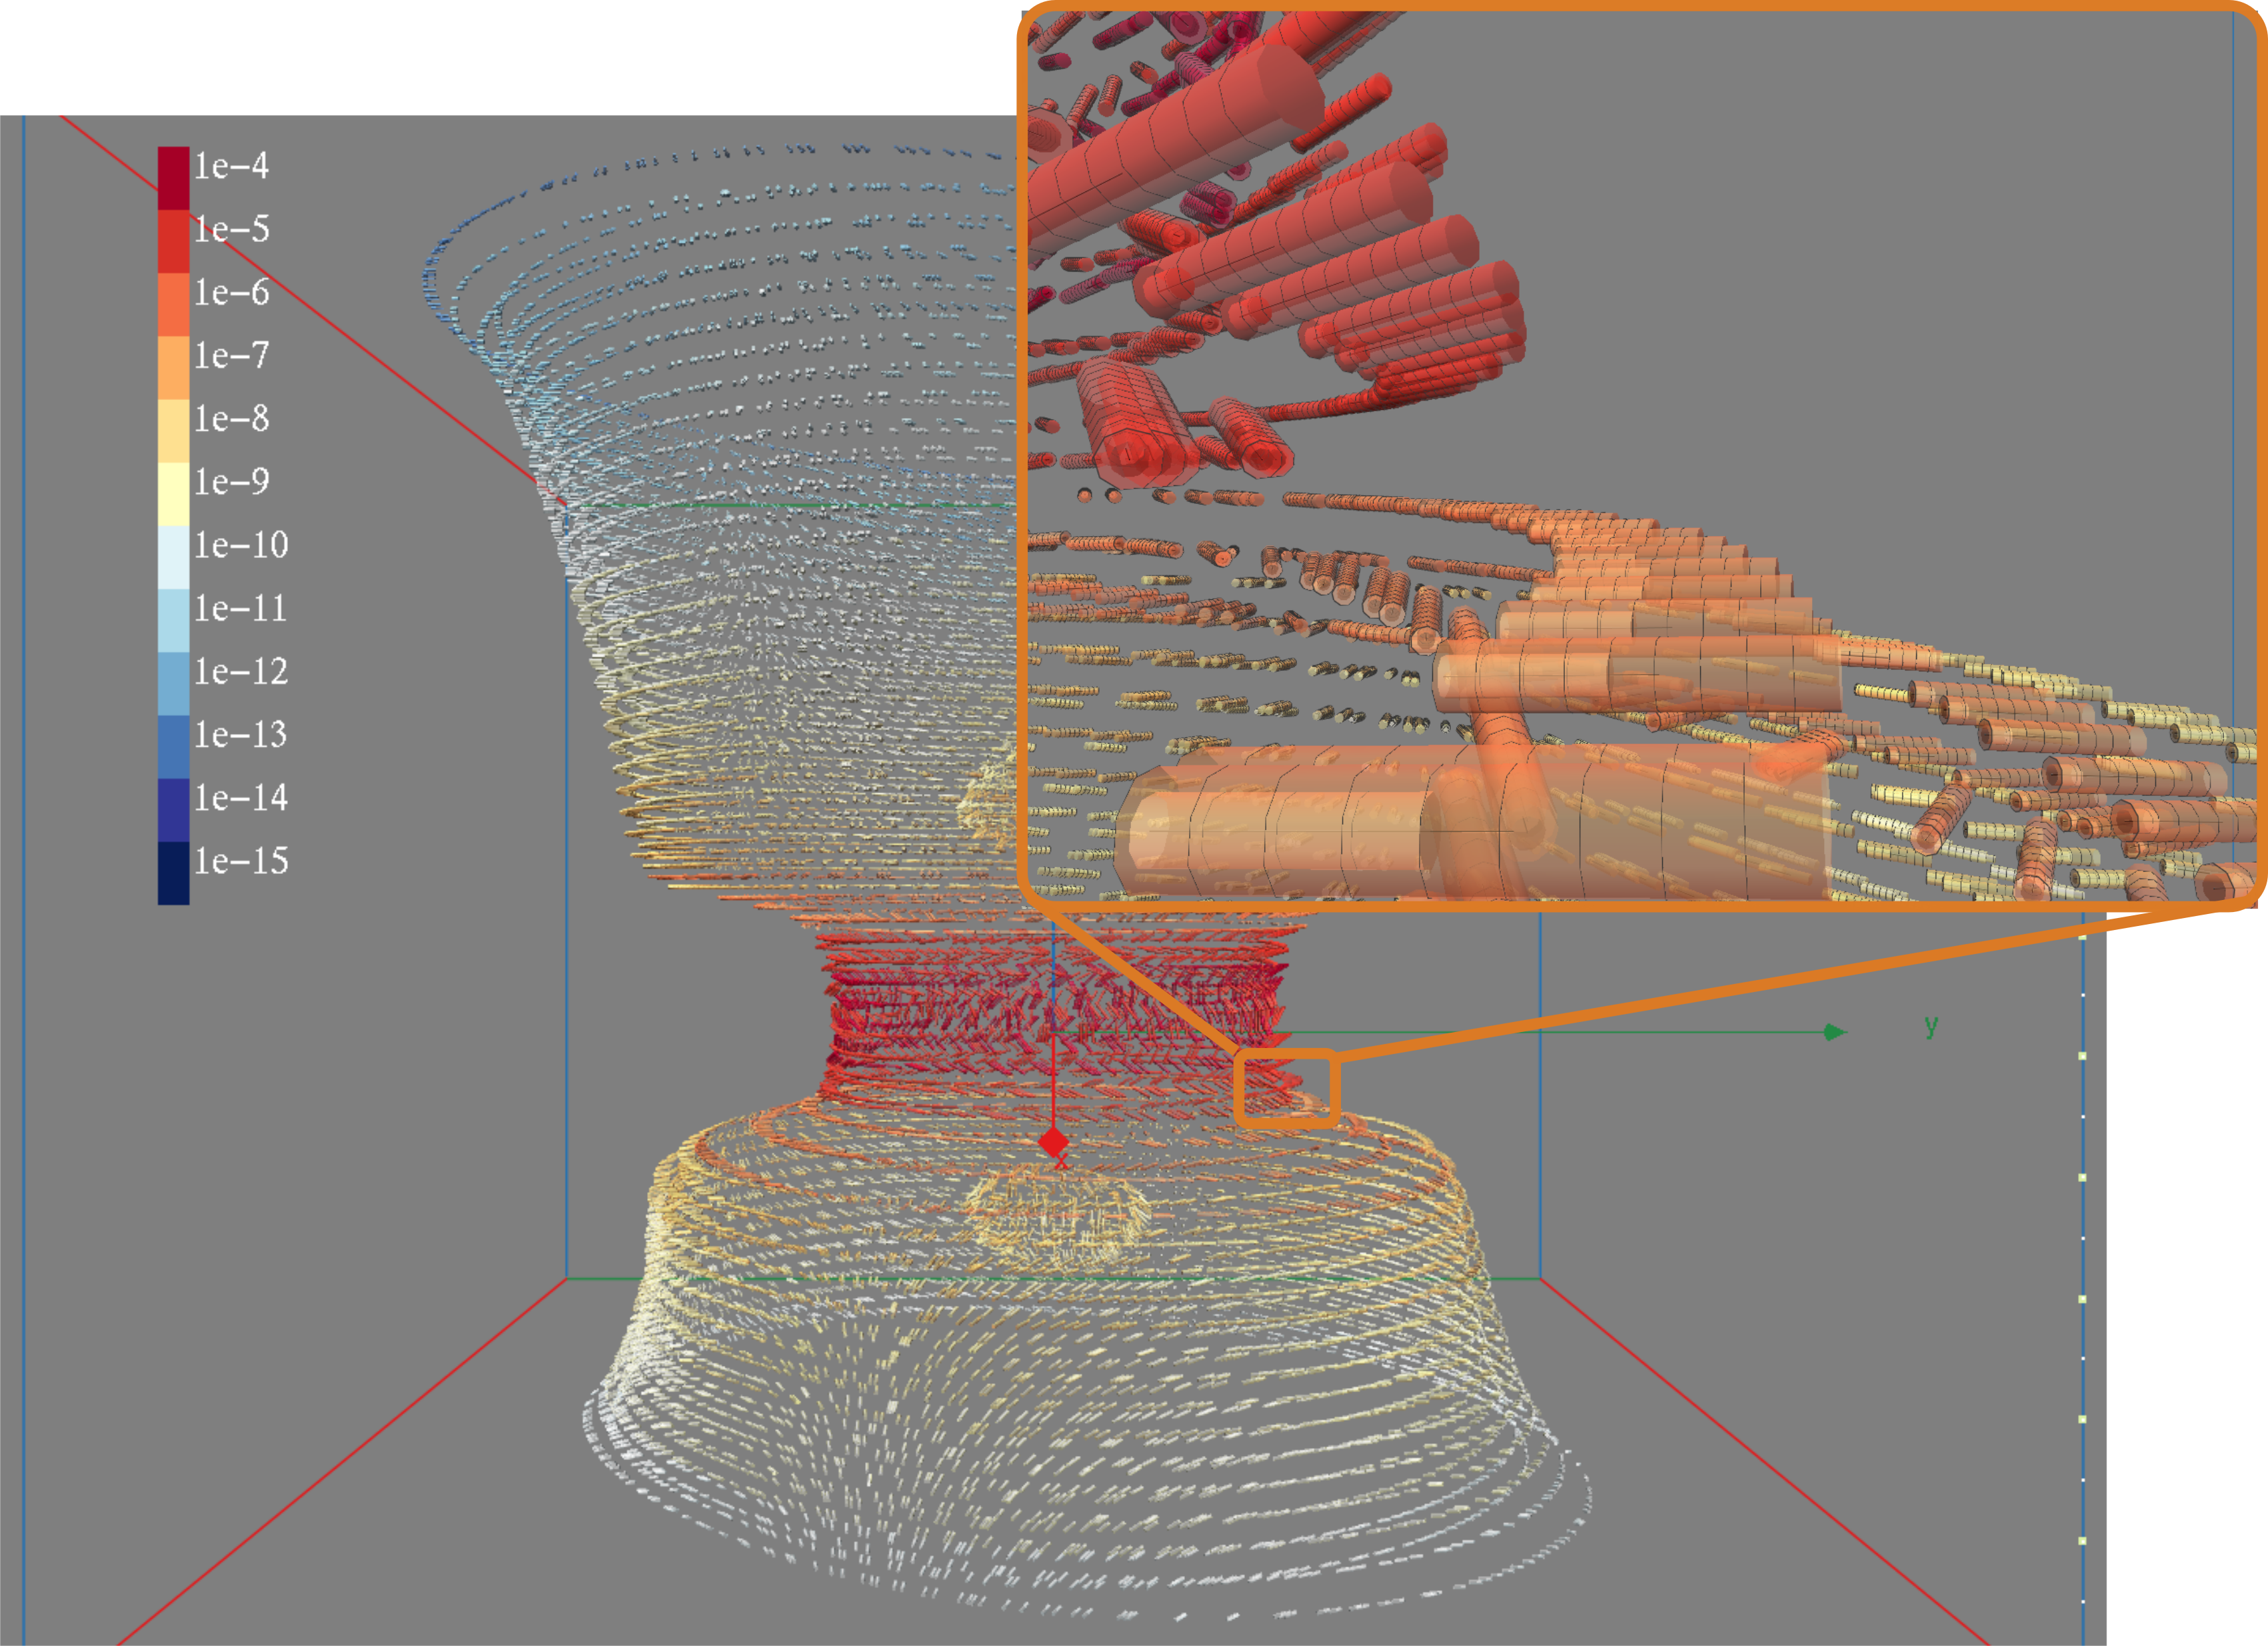
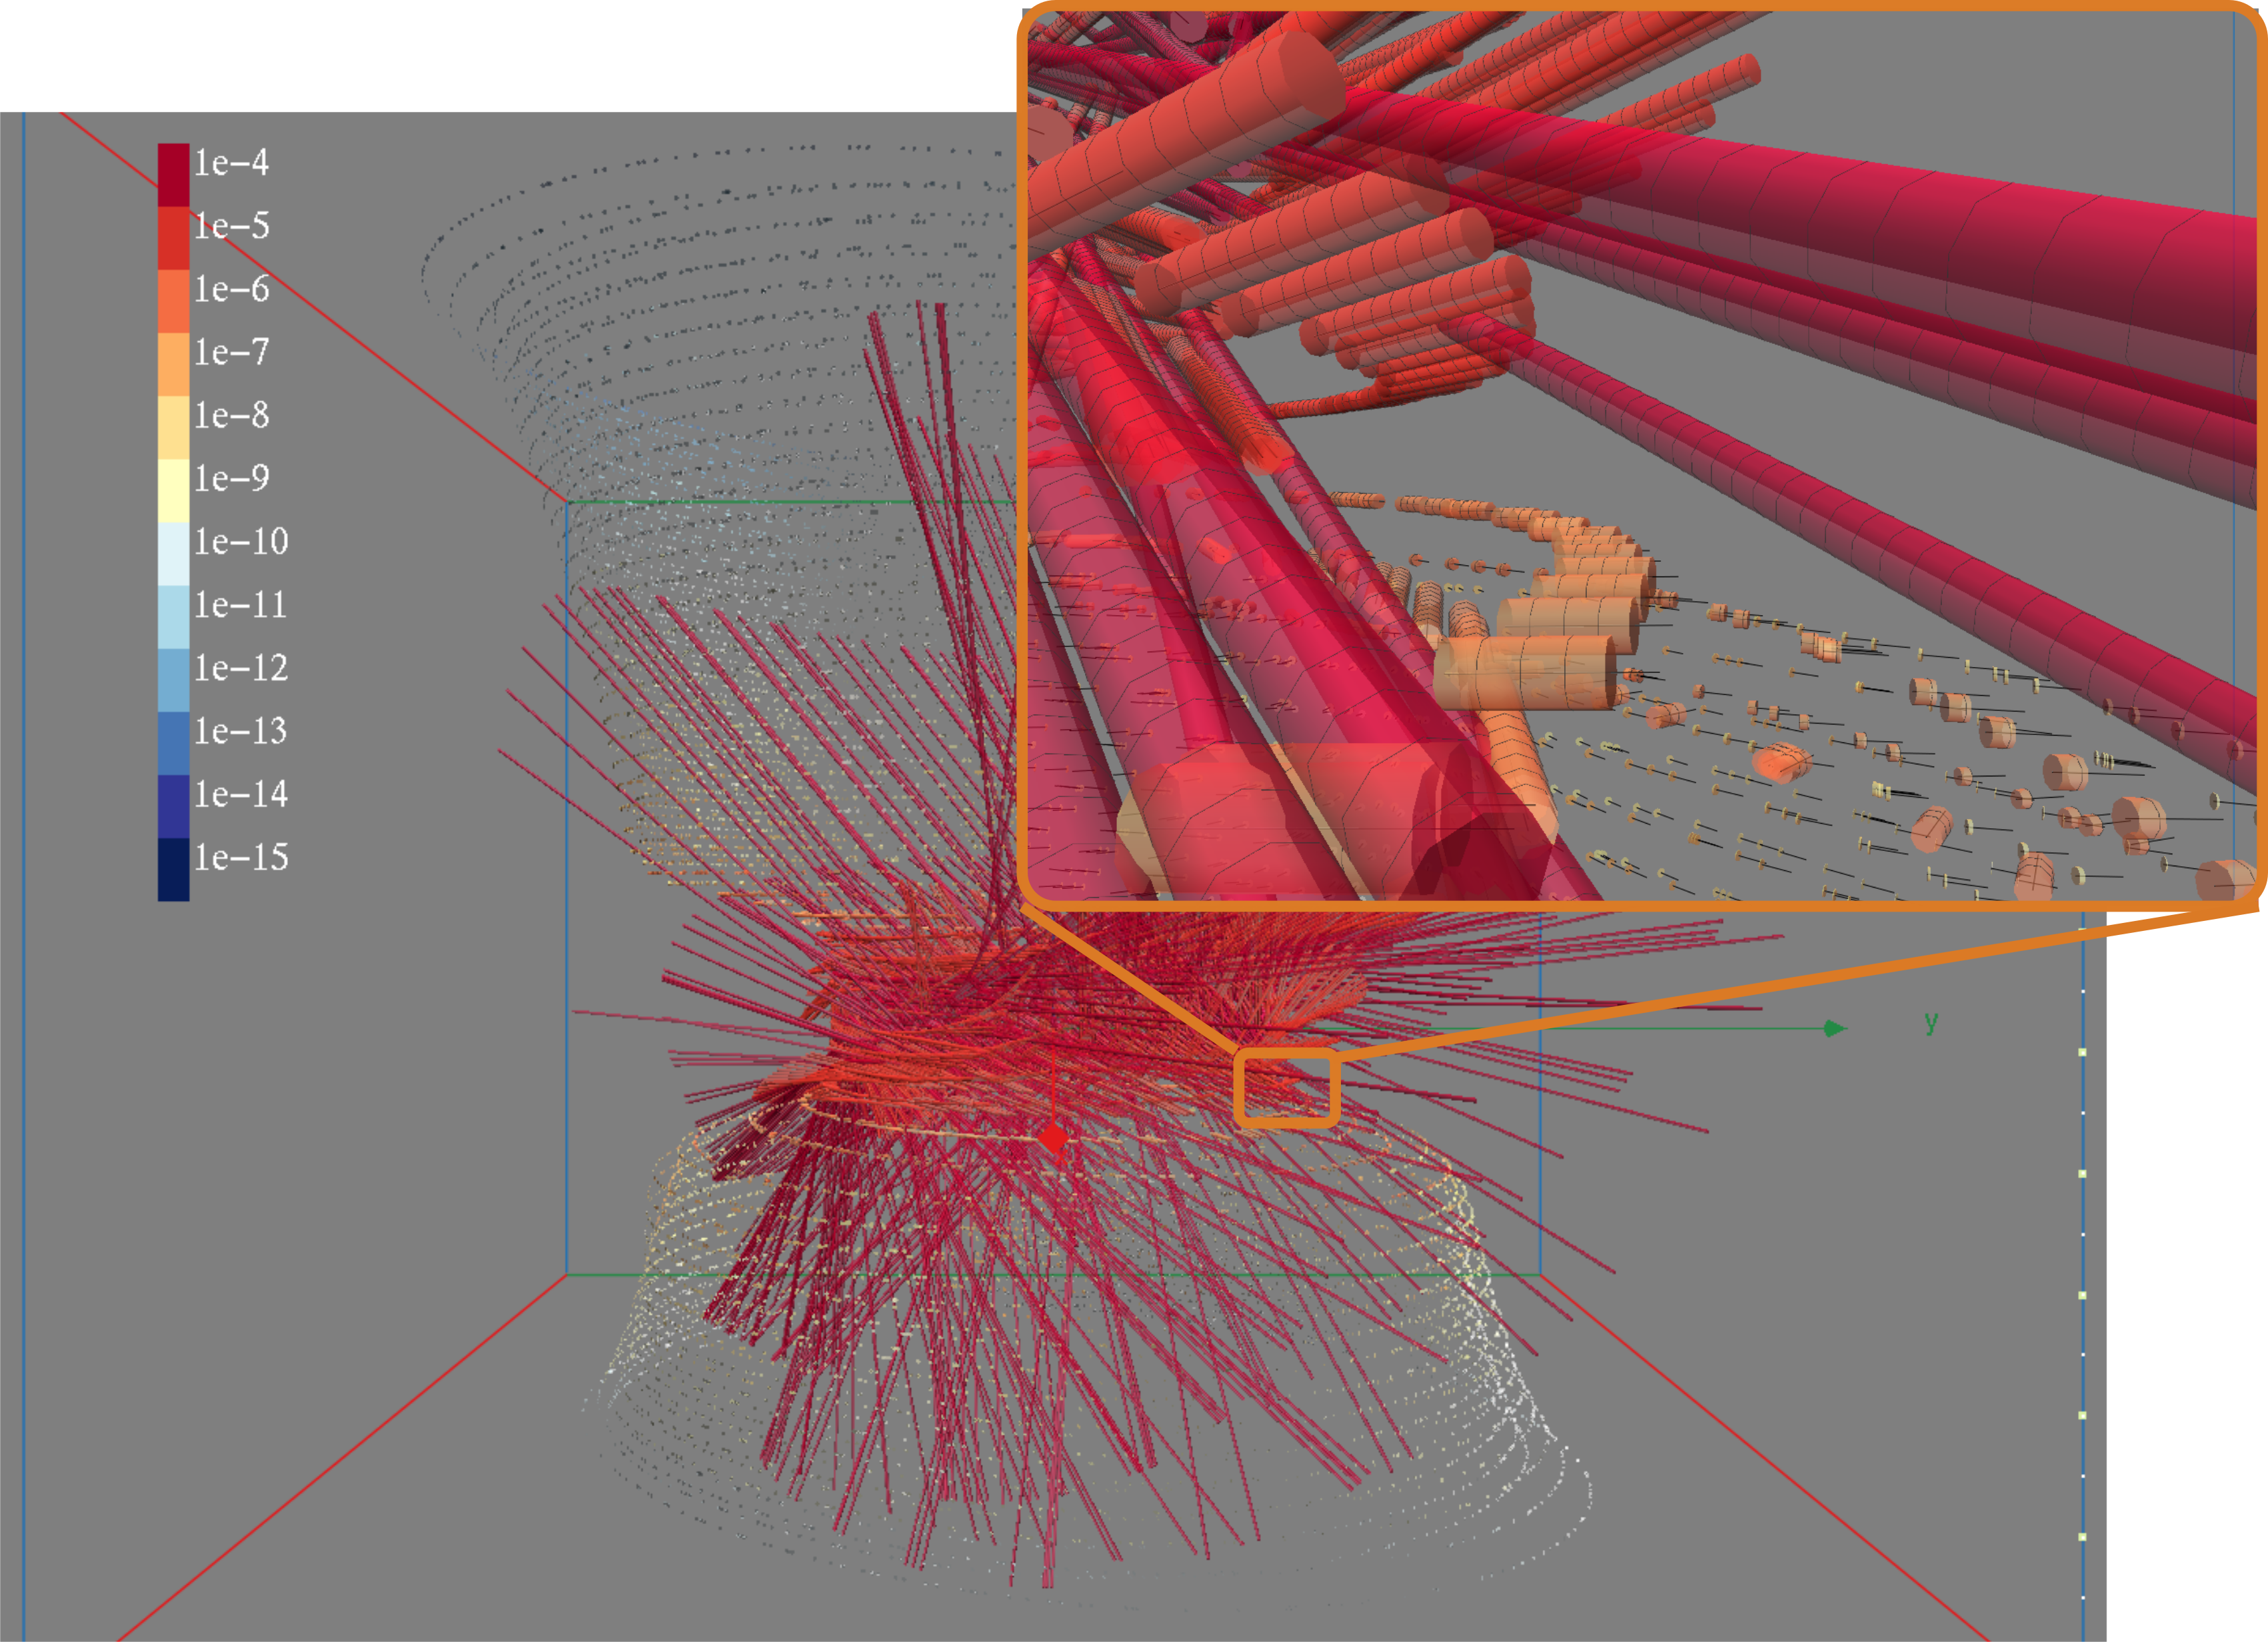
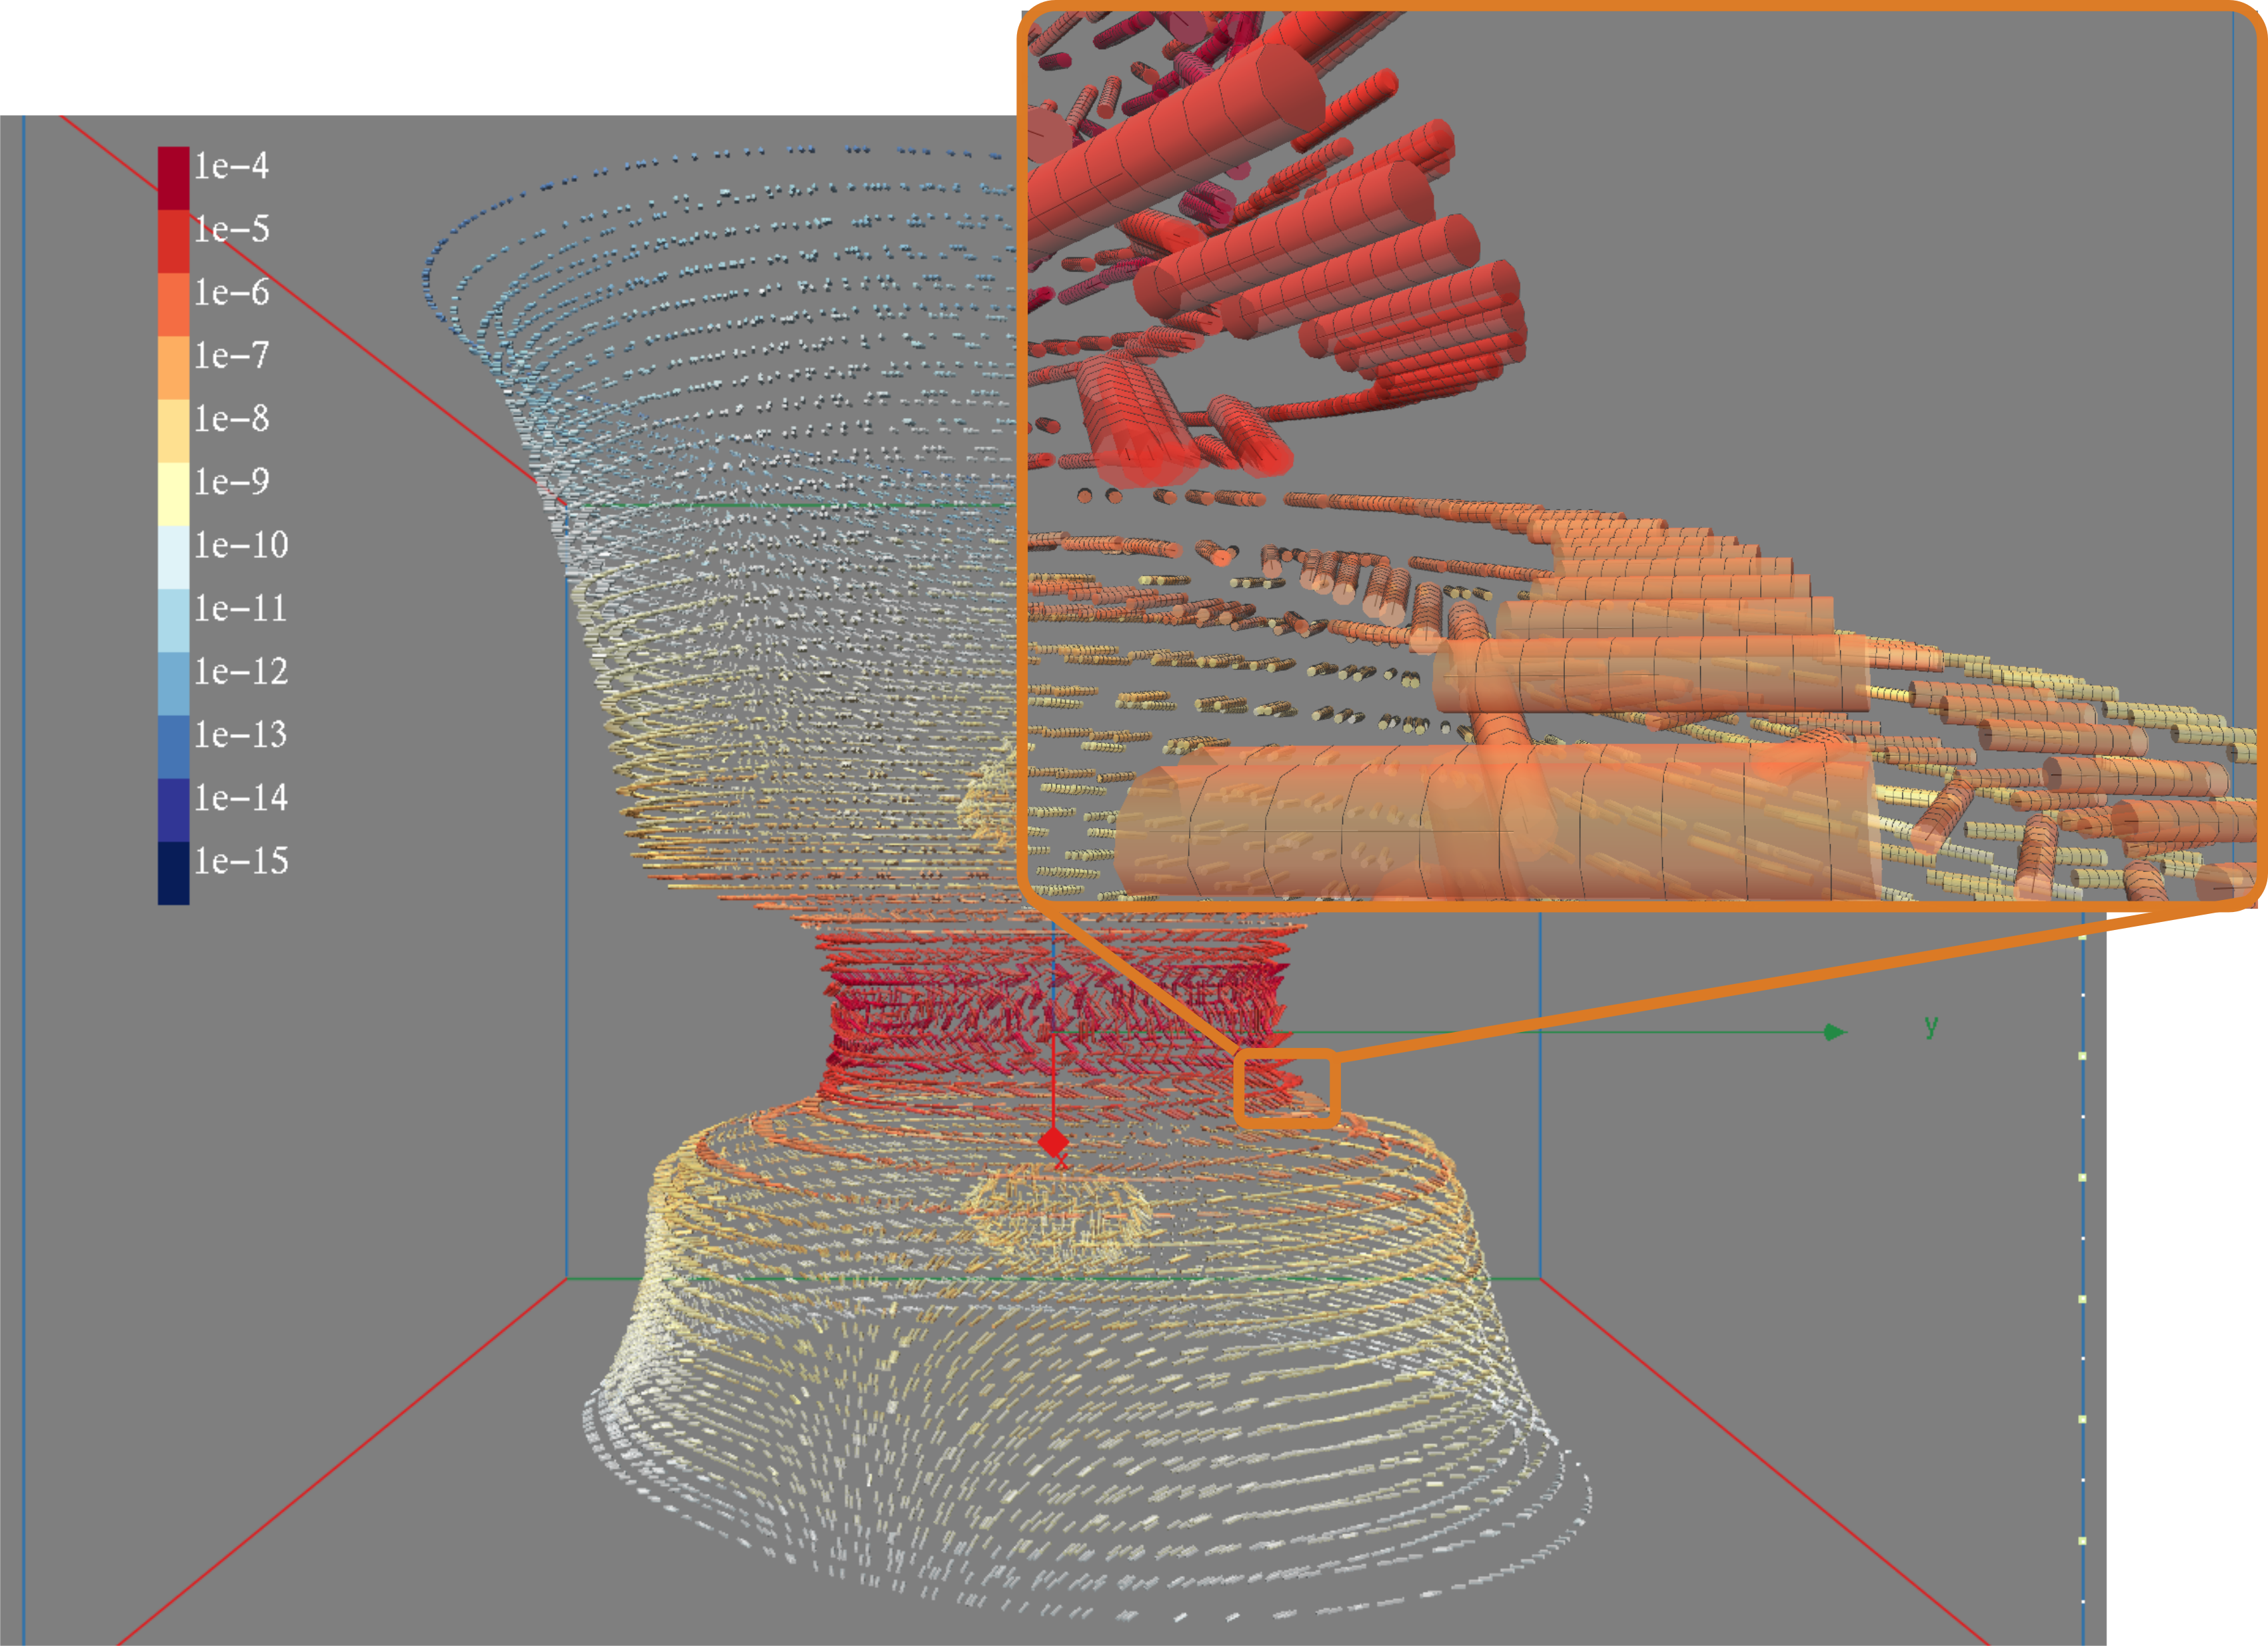
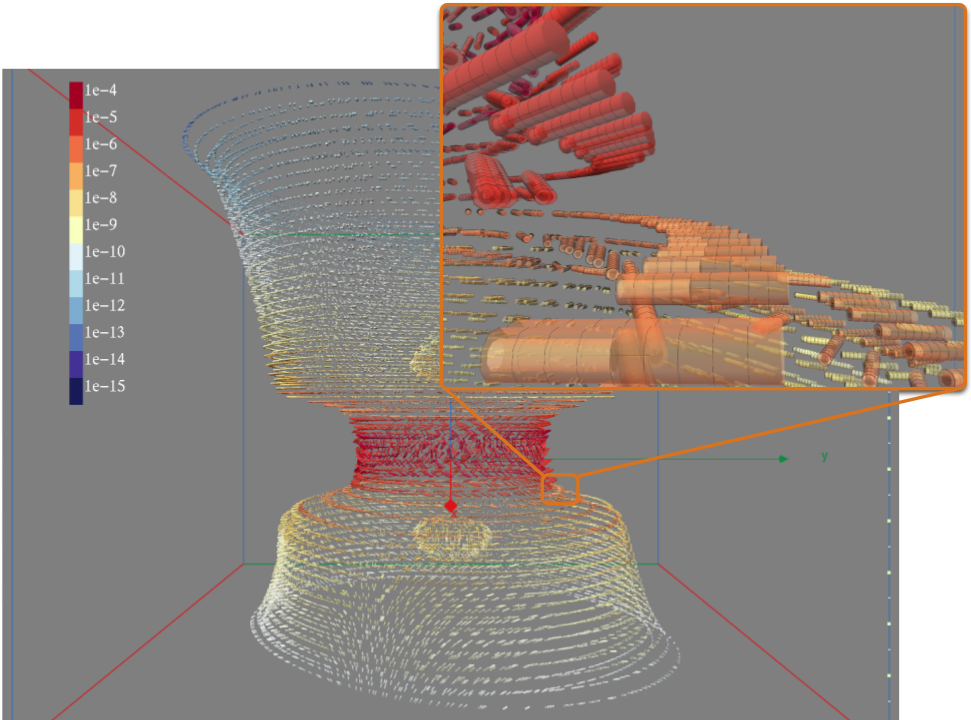
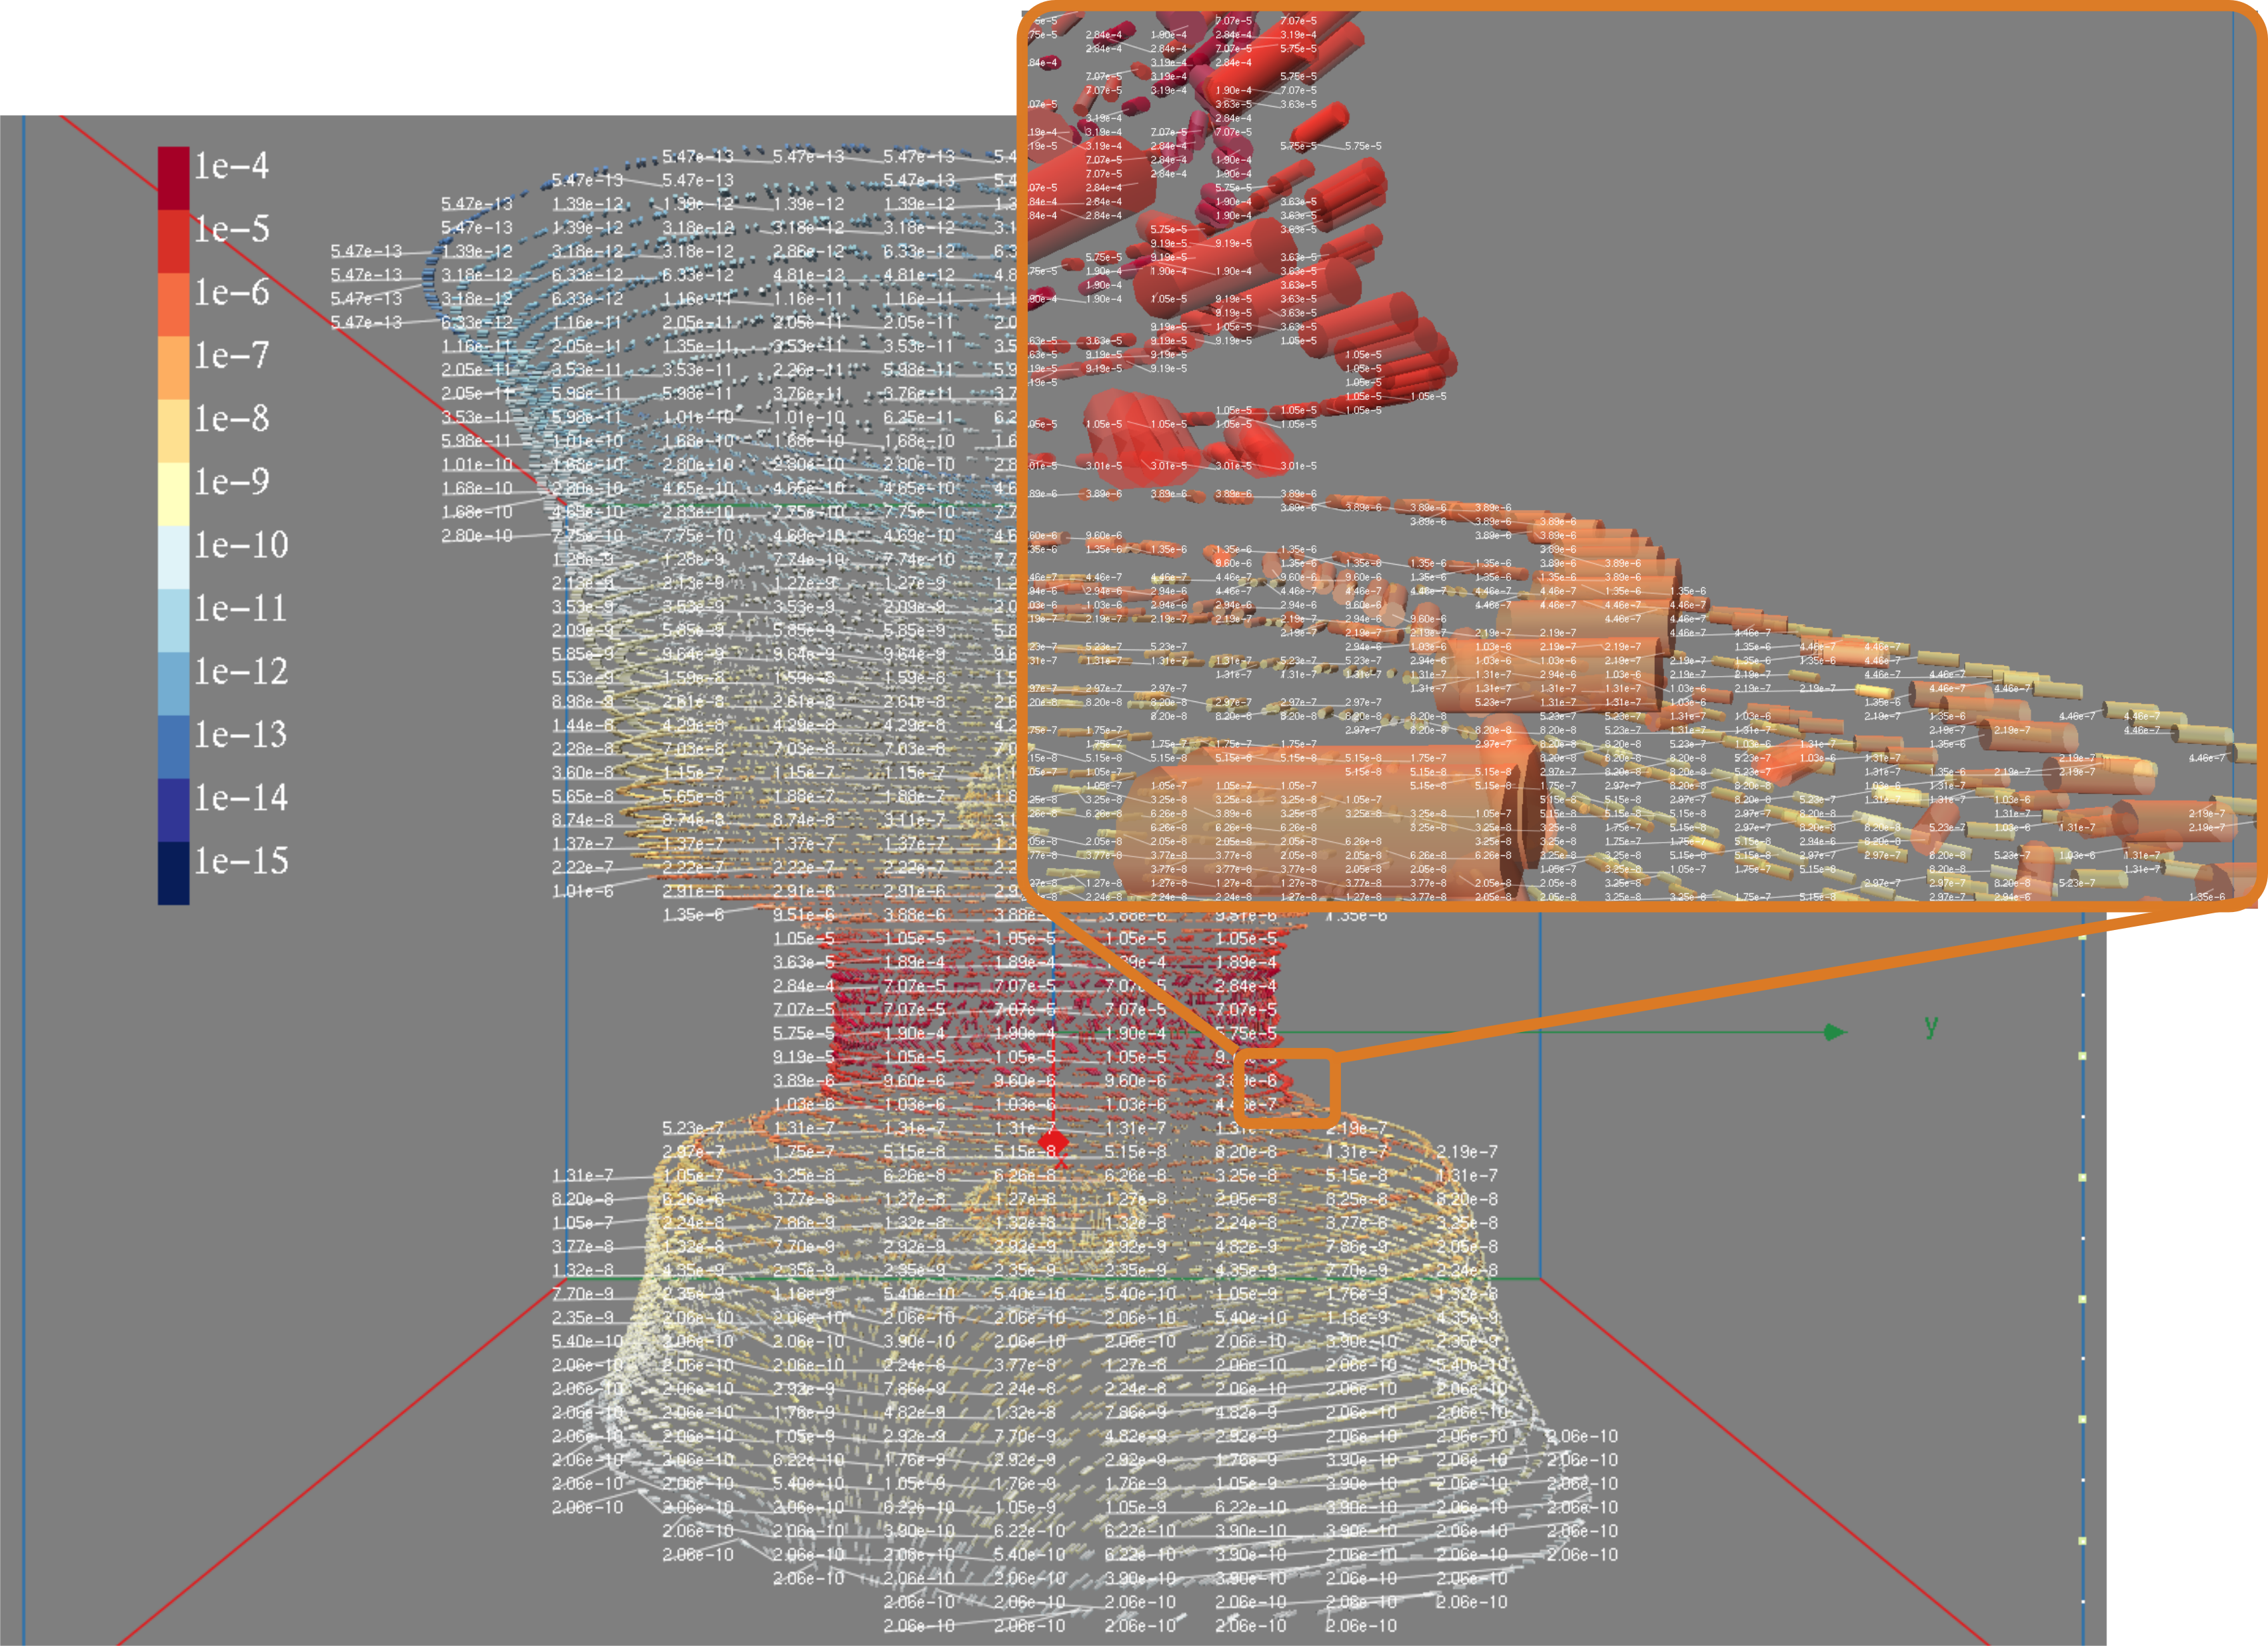
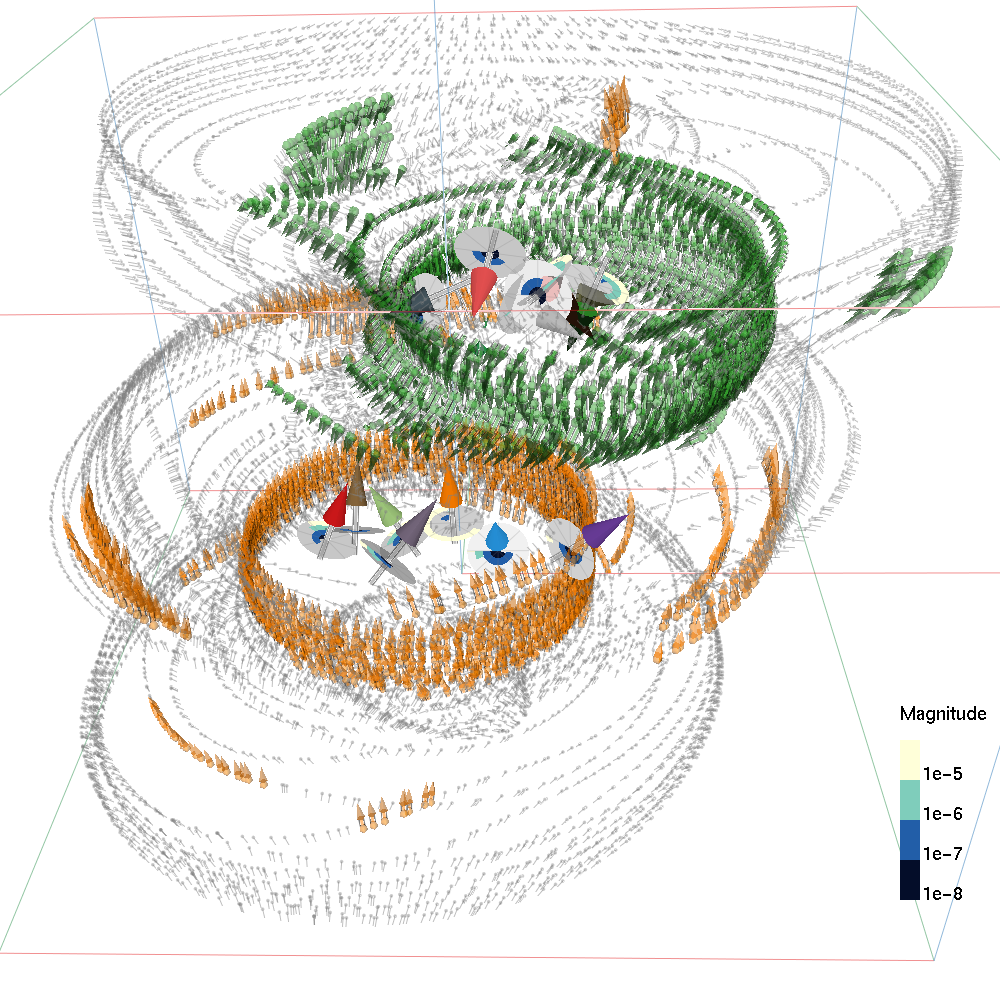
Figure 3: Examples of quantum physics data by SplitVectors: [1] [2] [3]
![[1]](images/splitvectors/splitvectors_two_planes.png)
![[2]](images/splitvectors/splitvectors_upper_plane.png)
![[3]](images/splitvectors/splitvectors_lower_plane.png)
Empirical Guidance on Integral and Separable Marker Substrate for Large Magnitude-Range Vector Fields.
Our previous SplitVectors approach has improved accuracy on local discrimination tasks for the large-magnitude-range vector fields, but failed for comparing two two single points. Thus we designed an empirical study to evaluate five bivariate glyphs for SplitVectors approach.
Figure 1: 3D legend of the five glyphs: length_y and length_y, length_x and length_y, color/length_x and length_y, color and length_y, texture and length_y.
Figure 2: 440 represented by the five glyphs: length_y and length_y, length_x and length_y, color/length_x and length_y, color and length_y, texture and length_y.
Accurate Exploration of Spatial Structures
Summary-based Overview Design: OverviewGlyph for Querying Complex Spa- tial Data Structures.
We designed the OvervewGlyph with arrows and discs to summarize orientations and magnitudes in each cluster: the direction of one arrow represents the average orientation in each cluster and the angles of colored circles on a disc represent the percentage values of orders of magnitudes in each cluster.
![[1]](images/summaryglyph/disc_shift_expand_3.png)
![[2]](images/summaryglyph/disc_fourleg_expand_5.png)
SPLIT: Multiscale and Guided Exploration of Quantum Physics Data
We designed and Implemented an interactive tool to assist in scientists in exploring spatial data precisely, by integrating information visualization and scientific visualization.
![[1]](images/tool/surface.png)
![[2]](images/tool/multiple.png)
![[3]](images/tool/repeat.png)
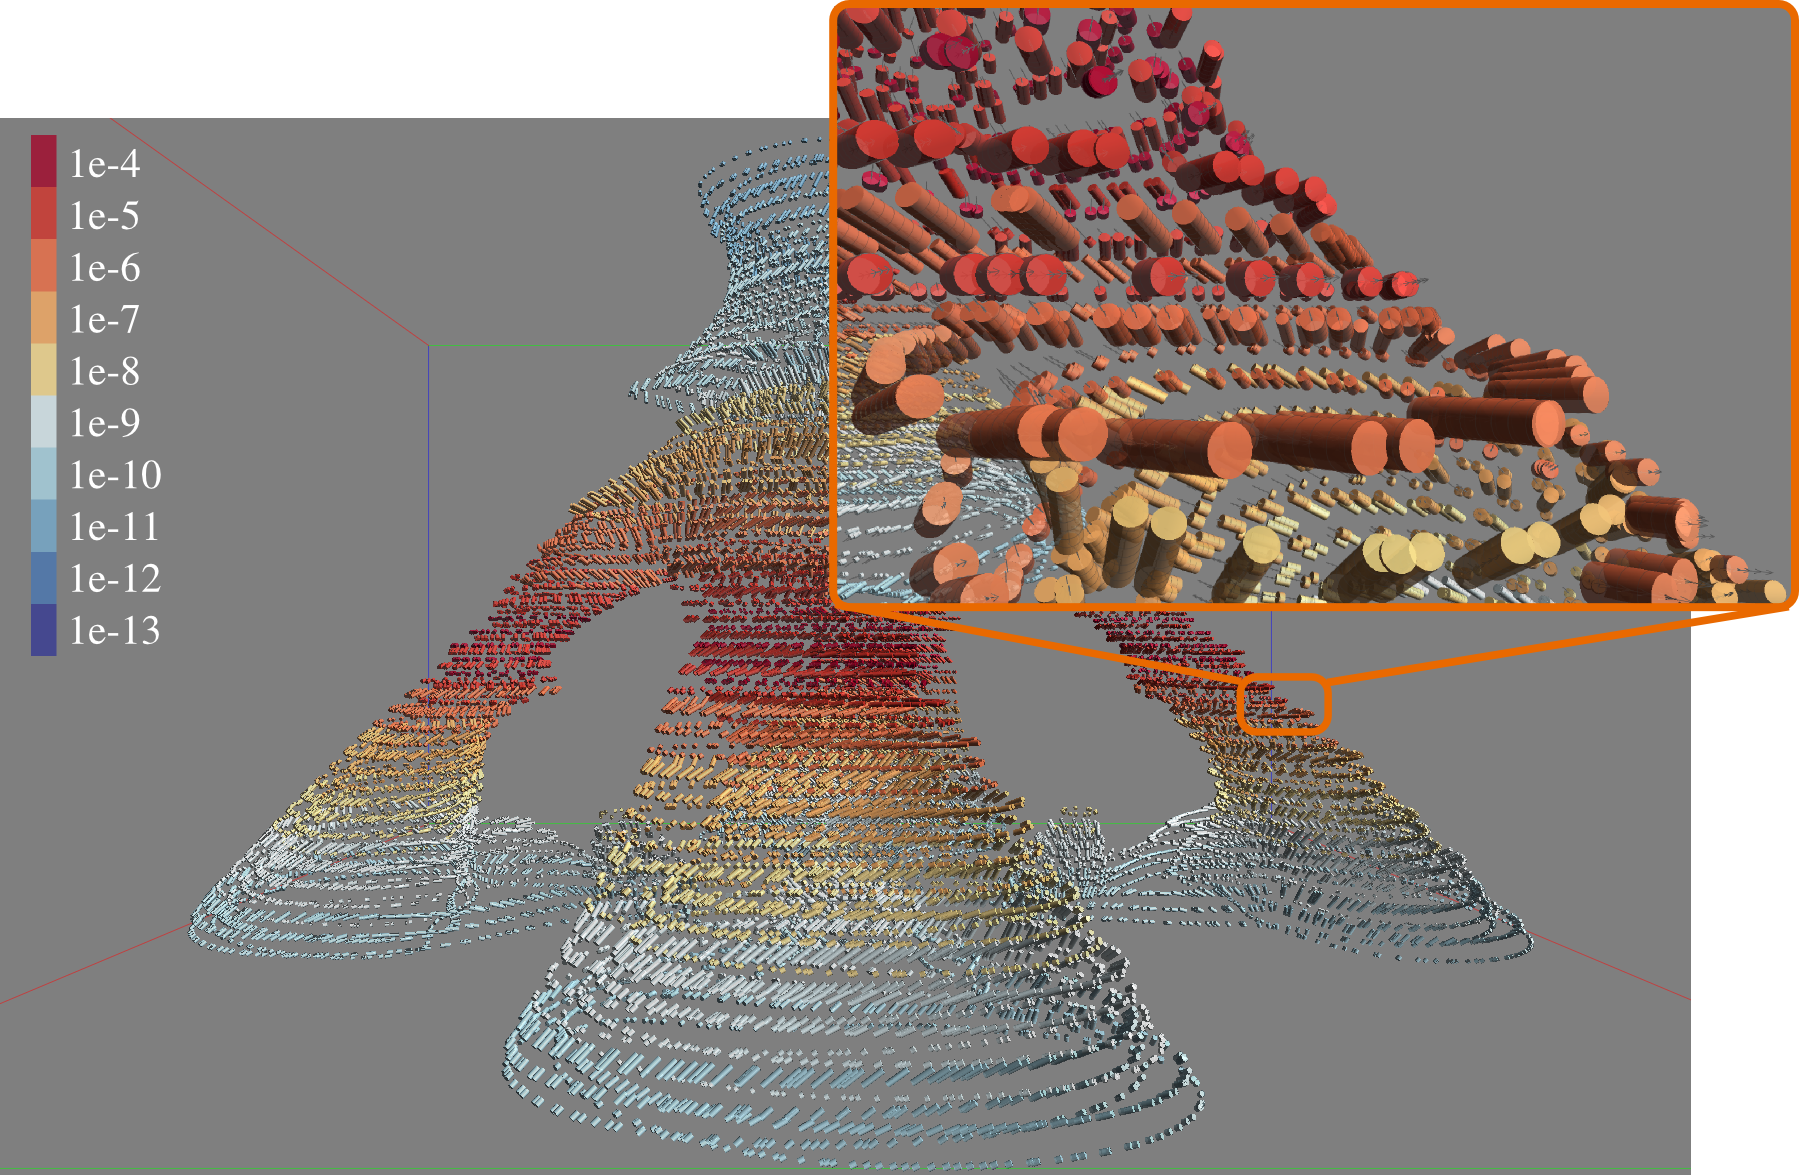
![[4]](images/tool/figure4.png)
Graduate Class Projects
Implementation of As-Rigid-As-Possible Shape Manipulation Algorithm
Class project of computer graphics.
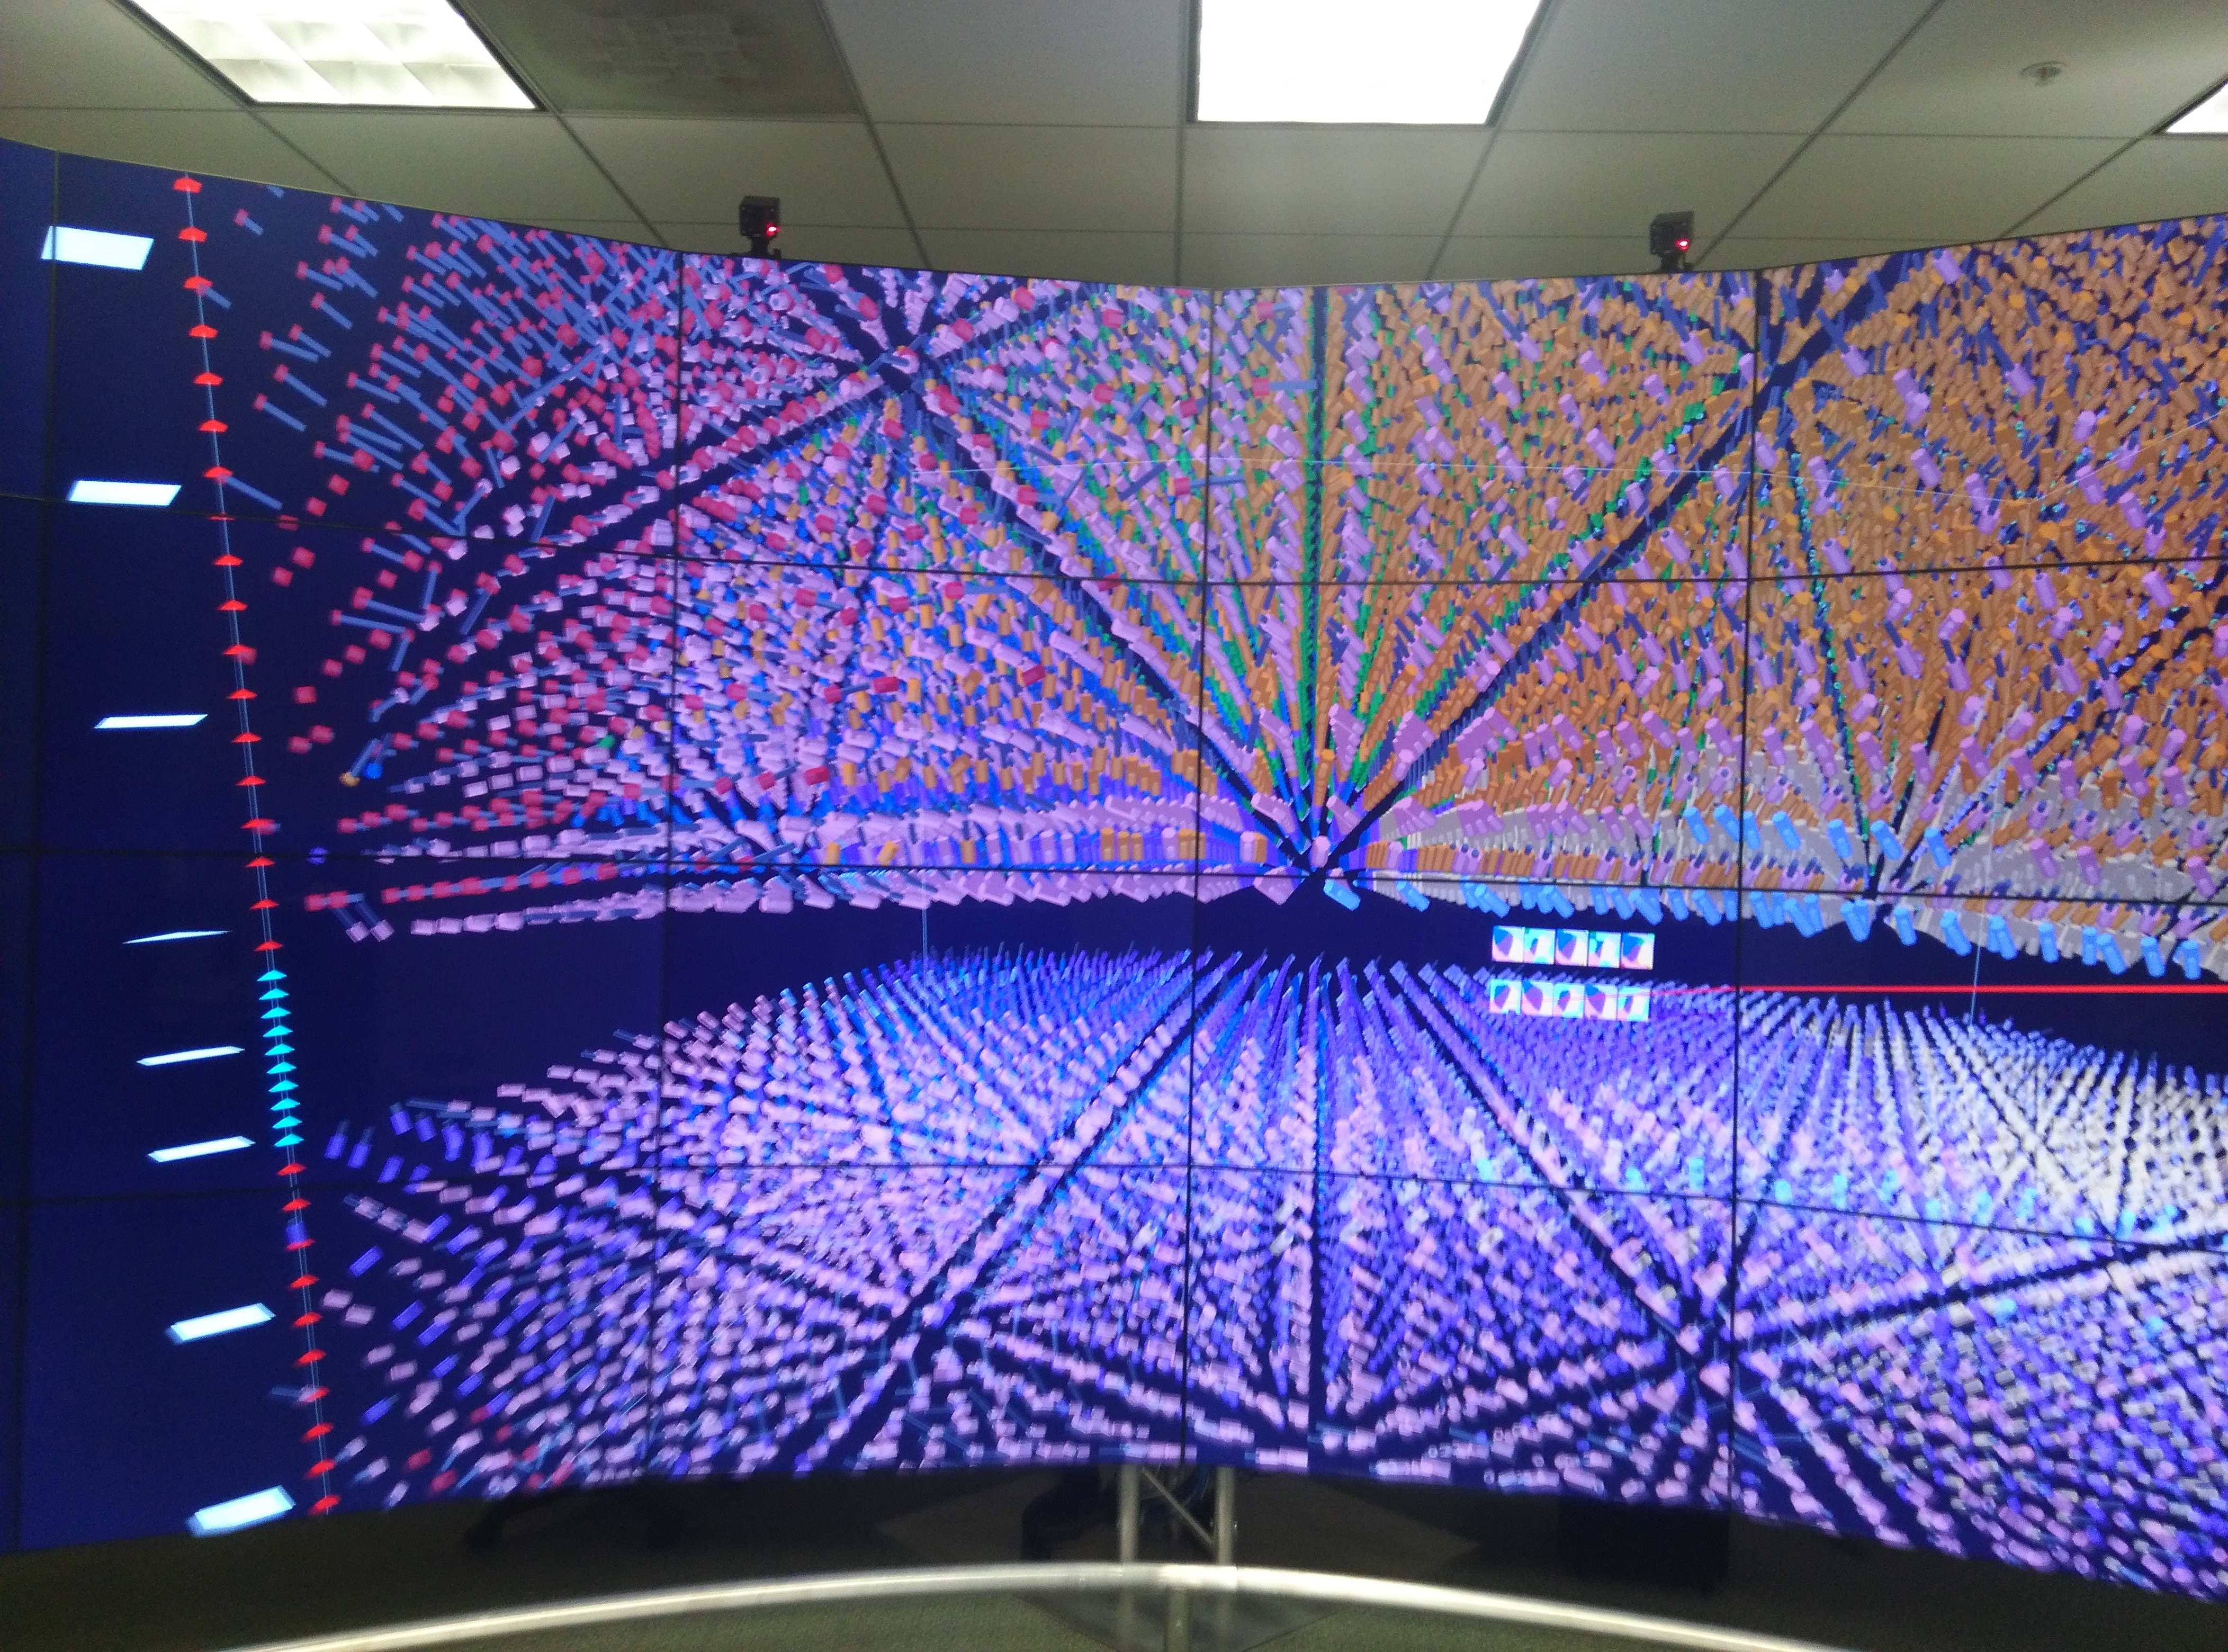
Integrated 2D+3D Visualization for Quantum Physics Data
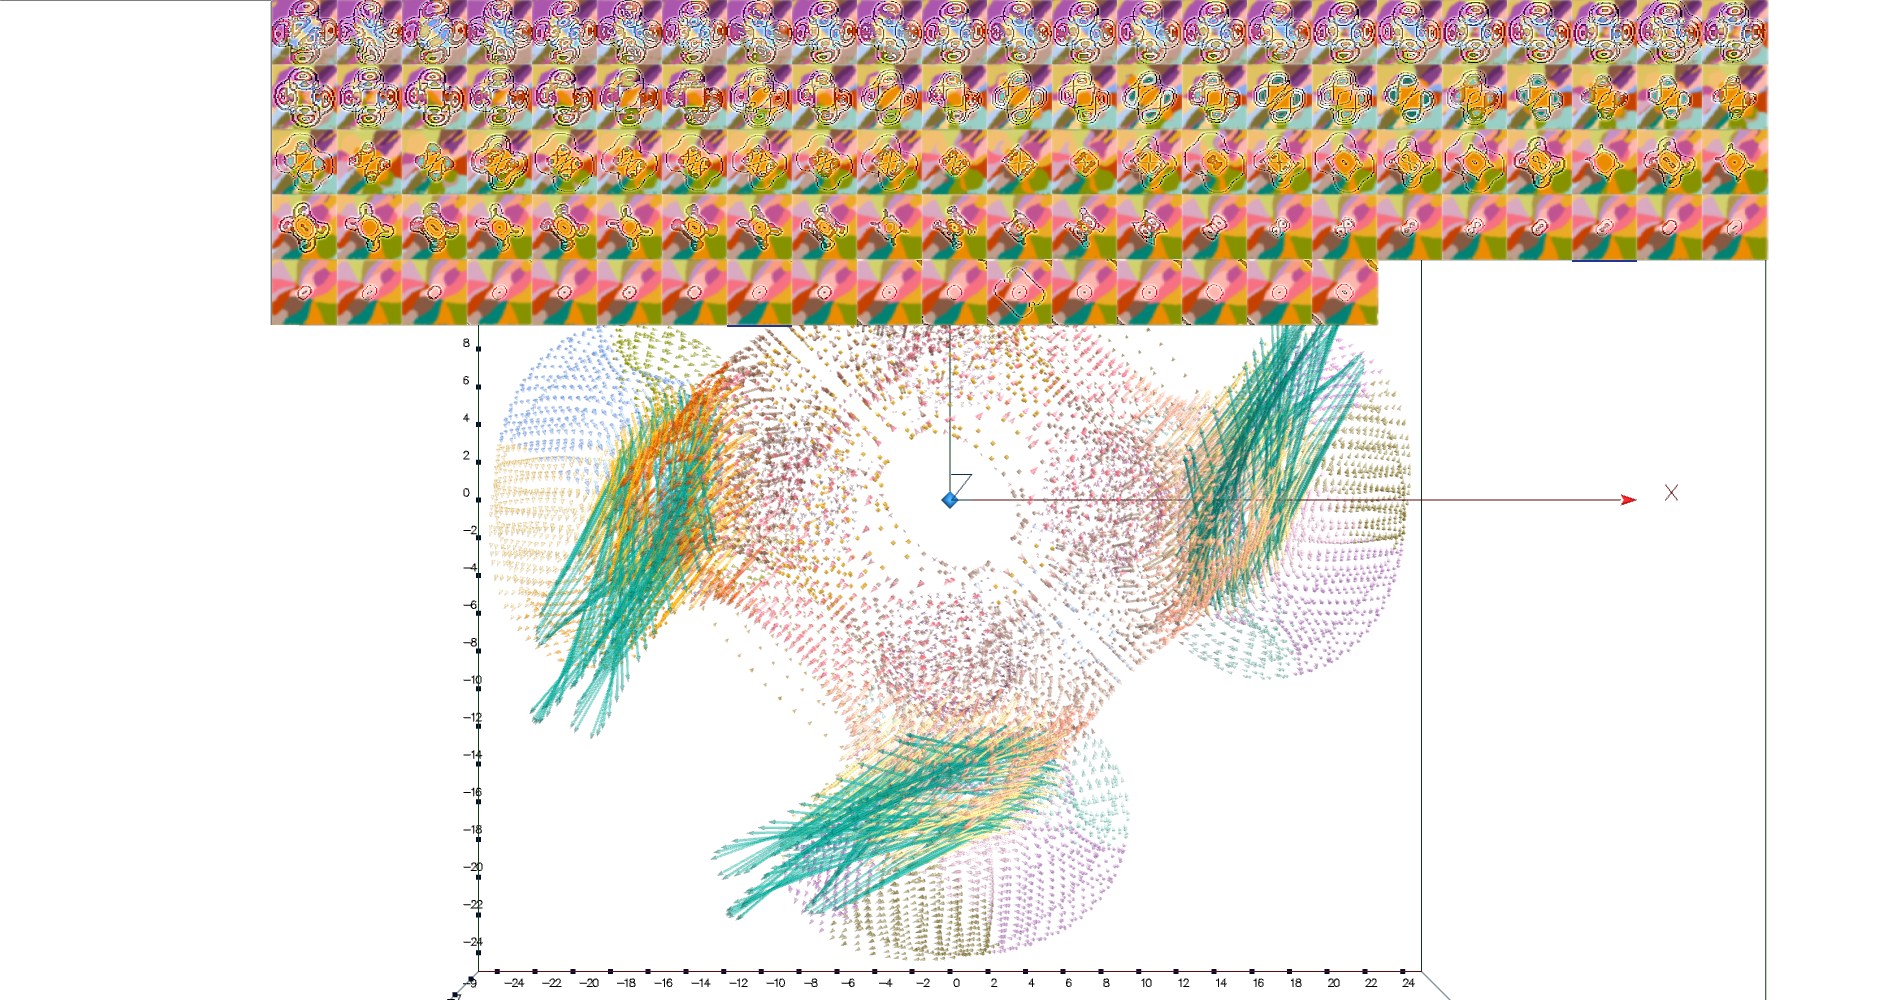
We presented and evaluated an interactive visualization technique that integrates both 2D and 3D perspectives of the dataset. This technique renders the two perspectives within the same view, allowing the user to toggle which perspective to utilize for a given region of interest. We then evaluated this method in a user study that measured accuracy time taken to draw accurate conclusions, and user satisfaction on pattern detection tasks.
![[1]](images/vrclass/2.jpg)
![[2]](images/vrclass/3.jpg)