Jesus J. Caban, Alark Joshi, and Penny Rheingans
Abstract:
Analyzing, visualizing, and illustrating changes within time-varying volumetric data is challenging due to the dynamic changes occurring between timesteps. The changes and variations in computational fluid dynamic volumes and atmospheric 3D datasets do not follow any particular transformation. Features within the data move at different speeds and directions making the tracking and visualization of these features a difficult task. We introduce a texture-based feature tracking technique to overcome some of the current limitations found in the illustration and visualization of dynamic changes within time-varying volumetric data. Our texture-based technique tracks various features individually and then uses the tracked objects to better visualize structural changes. We show the effectiveness of our texture-based tracking technique with both synthetic and real world time-varying data. Furthermore, we highlight the specific visualization, annotation, registration, and feature isolation benefits of our technique. For instance, we show how our texture-based tracking can lead to insightful visualizations of time-varying data. Such visualizations, more than traditional visualization techniques, can assist domain scientists to explore and understand dynamic changes.
Publication:
Jesus J. Caban, Alark Joshi and Penny Rheingans, "Texture-based feature tracking for effective time-varying data visualization", Proceedings of IEEE Visualization 2007, (to appear). [pdf]
Gallery:
Video:
Analyzing, visualizing, and illustrating changes within time-varying volumetric data is challenging due to the dynamic changes occurring between timesteps. The changes and variations in computational fluid dynamic volumes and atmospheric 3D datasets do not follow any particular transformation. Features within the data move at different speeds and directions making the tracking and visualization of these features a difficult task. We introduce a texture-based feature tracking technique to overcome some of the current limitations found in the illustration and visualization of dynamic changes within time-varying volumetric data. Our texture-based technique tracks various features individually and then uses the tracked objects to better visualize structural changes. We show the effectiveness of our texture-based tracking technique with both synthetic and real world time-varying data. Furthermore, we highlight the specific visualization, annotation, registration, and feature isolation benefits of our technique. For instance, we show how our texture-based tracking can lead to insightful visualizations of time-varying data. Such visualizations, more than traditional visualization techniques, can assist domain scientists to explore and understand dynamic changes.
Publication:
Jesus J. Caban, Alark Joshi and Penny Rheingans, "Texture-based feature tracking for effective time-varying data visualization", Proceedings of IEEE Visualization 2007, (to appear). [pdf]
Gallery:
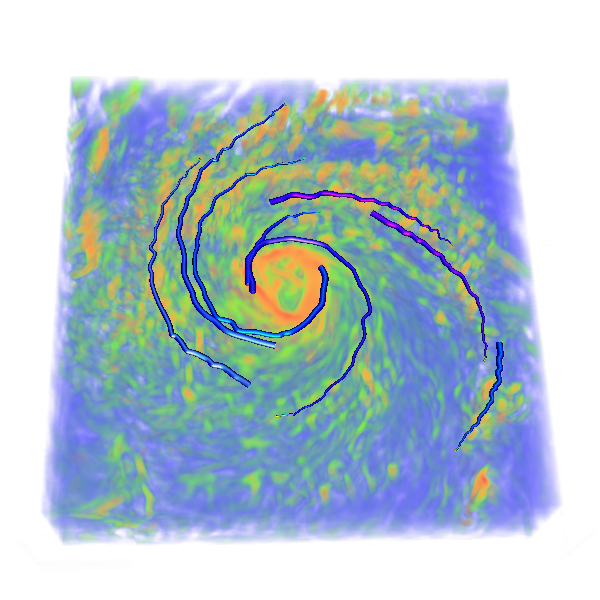
Figure 1: Resulting path after tracking a number of independent features over time using our texture-based feature tracking technique. |
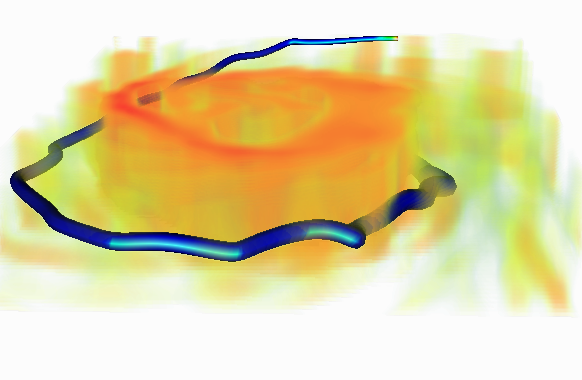
Figure 2: Results of tracking a hurricane feature close to the eyewall over 30 consecutive timesteps. |
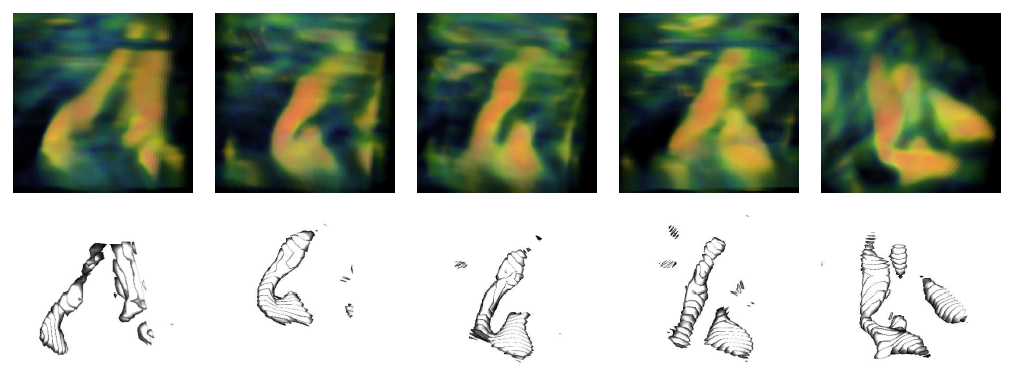
Figure 3: Visualization and illustration of a specific hurricane feature over time. Our technique provides the flexibility to track, isolate, and illustrate specific feature changes and variations over time. |
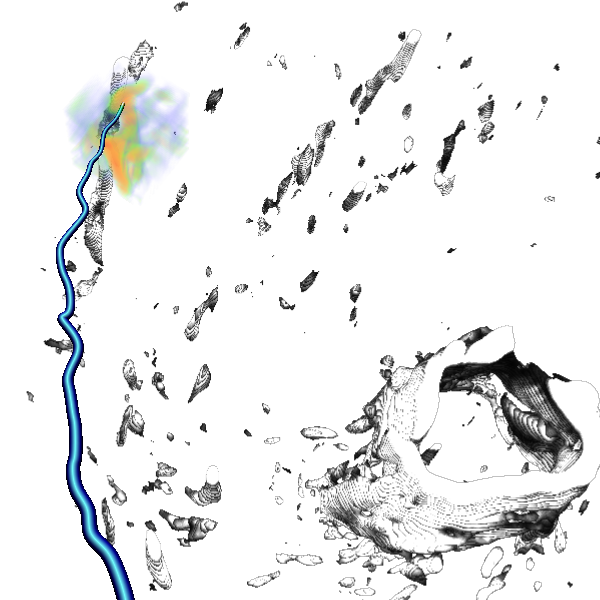
Figure 4: Direct volume rendering of the hurricane feature under consideration within the illustration of the overall structure of the hurricane. |
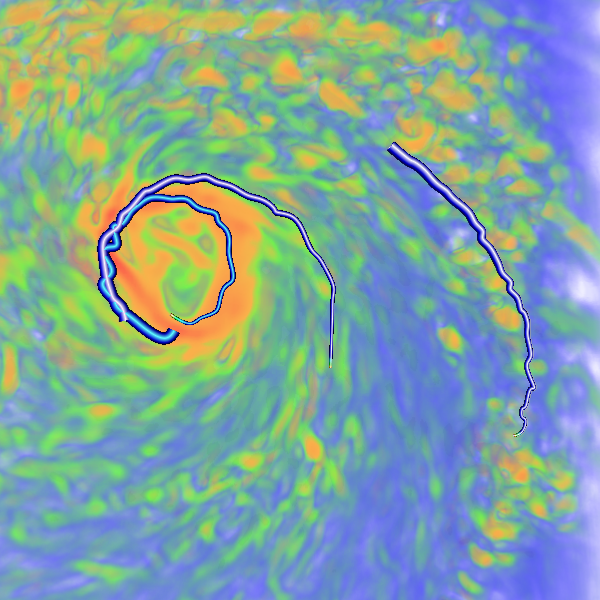
Figure 5: Path followed by three independent features over the same period of time. |
Video: